MeterGuard | Smart meter firmware pre-flight

A lower firmware risk estimate still needs a release boundary

A synthetic hotfix sharply reduces predicted meter failures, yet still receives NO-GO. We show how fleet condition, modeled uncertainty and missing evidence shape a firmware rollout recommendation.

11 min 55 sec walkthrough. Synthetic fleets and manifests; no real meter release.

2.85%

Hotfix mean modeled failure rate

Synthetic Plano case, 86,078 scored endpoints

4.10%

Upper modeled interval rate

Same case, 90% modeled count interval

3.0%

Configured NO-GO boundary

Hard block at or above this upper rate

For utility AMI leads and firmware change owners: inspect what a recommendation covers, what triggers it and which evidence remains unresolved.

An improved estimate can still fail the release policy

A release label describes intent. A pre-flight needs to examine the proposed behavior against the fleet that will receive it. In this demo, battery condition, radio recovery and flash wear influence modeled failures, so an average improvement alone cannot answer whether a candidate meets the declared risk boundary.

The worked case uses a generated fleet labelled Plano Water and synthetic firmware manifests. The initial battery-optimization estimate predicts 63,883 failures among 86,078 scored endpoints. An inrush-capped hotfix reduces that estimate to 2,449, but its upper modeled rate remains 4.10%. Both receive NO-GO under the same 3.0% upper-risk rule.

The distinction matters when inspecting pre-flight evidence: ask which population was scored, what the uncertainty includes and which rule permits the release. A favorable comparison with an earlier candidate answers only one of those questions.

From estimated behavior to an inspectable recommendation

Estimate the write behavior

The firmware profiler reads a synthetic changelog and estimates modem current, extra flash-write current, recovery probability and write amplification. The recorded examples use cached model-assisted profiles. A deterministic heuristic can supply a fallback when bridge output is unavailable or unparseable; neither path measures a firmware binary.

Model this fleet

Python/NumPy models voltage sag, reset, failed recovery and flash corruption using assumed mechanisms. Each pre-flight uses 200 Monte Carlo iterations and seed 1234. The 90% modeled count interval is the 5th-to-95th percentile of simulated counts, not guaranteed field coverage.

Policy orderConfigured conditionRecommendation
1. Upper riskUpper interval rate at or above 3.0%NO-GO
2. Evidence confidenceBelow the hard block, but profile confidence is lowSTAGED-CANARY
3. Mean riskBelow the hard block, confidence is not low and mean is at or below 0.5%GO
4. Remaining riskBelow the hard block with an intermediate meanSTAGED-CANARY

The deterministic policy gate issues a local recommendation. The governance adjudicator writes an advisory memo afterward and cannot directly override the verdict. Profile accuracy still matters because the estimate supplies the simulator inputs.

Missing telemetry is excluded from the prediction denominator and recommended for manual review. A non-GO recommendation proposes 500 of the lowest-modeled-risk endpoints, a 72-hour hold and re-evaluation with observed canary telemetry; widening requires an observed failure rate below 0.1%. This app executes neither the canary nor the review.

Follow the hotfix from estimated improvement to release boundary

All fleets, manifests, version labels and records shown here are synthetic. These actual captures use cached model-assisted profiles, 200 Monte Carlo iterations and seed 1234. A modeled recommendation is not an executed firmware release or independent evidence of field safety.

Worked example: a much lower estimate, the same NO-GO

Start with the generated Plano Water population of 88,000 endpoints. The snapshot scores 86,078 and excludes 1,922 with insufficient telemetry. We compare an initial battery-optimization manifest with an inrush-capped hotfix against that same population and policy, so the improvement and the remaining release boundary can be inspected separately.
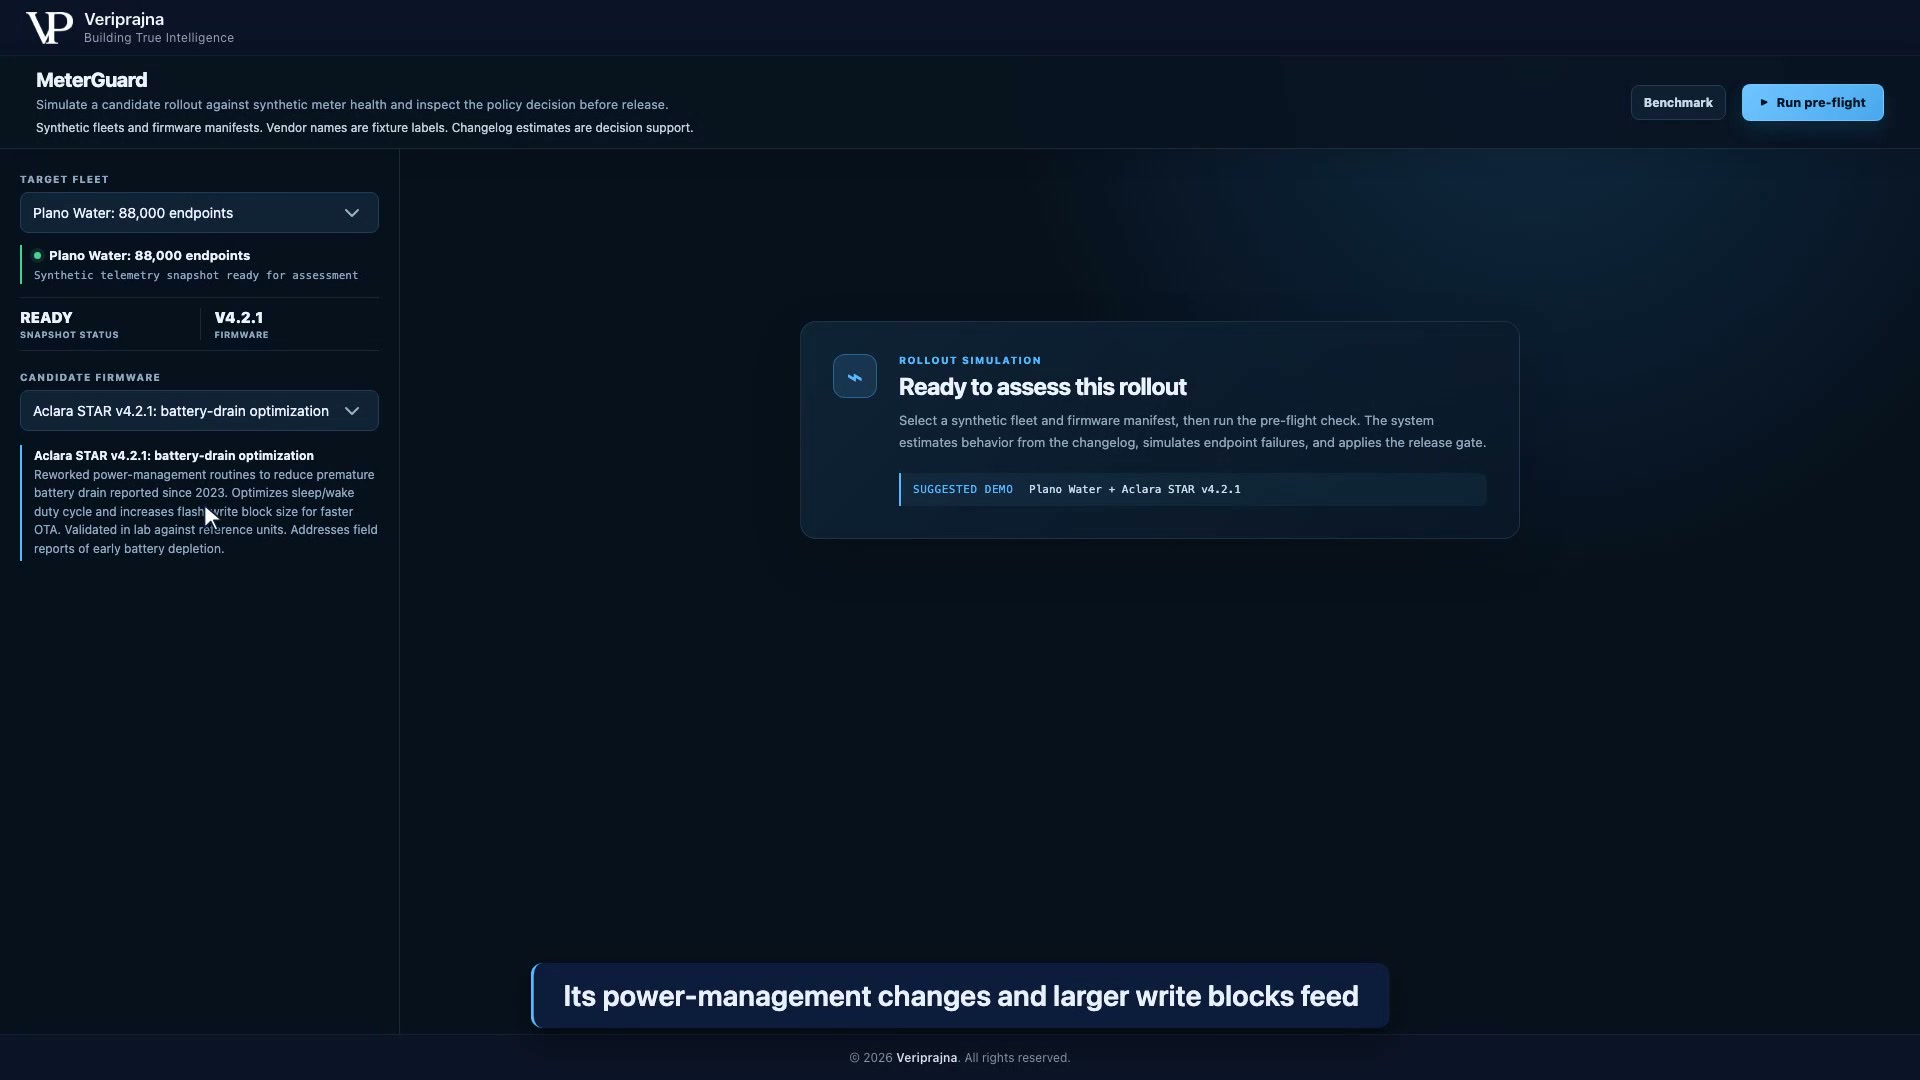
MeterGuard input screen with the synthetic Plano population and initial battery-optimization manifest selected.
Synthetic Plano population and STAR v4.2.1 manifest before pre-flight. Vendor, version, lab and field-report wording belongs to the authored fixture, not verified manufacturer or incident evidence. Open the image for full-size inspection.

1. Inspect the behavior estimate before trusting the release label

The initial cached profile estimates 120 mA baseline modem current plus 100 mA extra current during a flash write. Its recovery probability after reset is 0.02. The hotfix profile changes these inputs to 100 mA baseline, 10 mA extra current and 0.96 recovery probability. These are changelog-derived estimates, not current measured on hardware or analysis of a firmware binary.

Estimated inputs for the same synthetic Plano population
Profile inputInitial manifestHotfix manifest
Baseline modem current120 mA100 mA
Extra flash-write current100 mA10 mA
Re-registration probability after reset0.020.96
Write amplification0.0180.004
Profile confidence tokenHighHigh

The generated population has median battery charge 69.0% and median age 4.4 years. In the assumed voltage-sag model, a flash write can cause a reset when terminal voltage drops below 3.30 V; failed radio recovery and flash corruption contribute to modeled failures. A high confidence token does not establish calibrated certainty about those inputs.
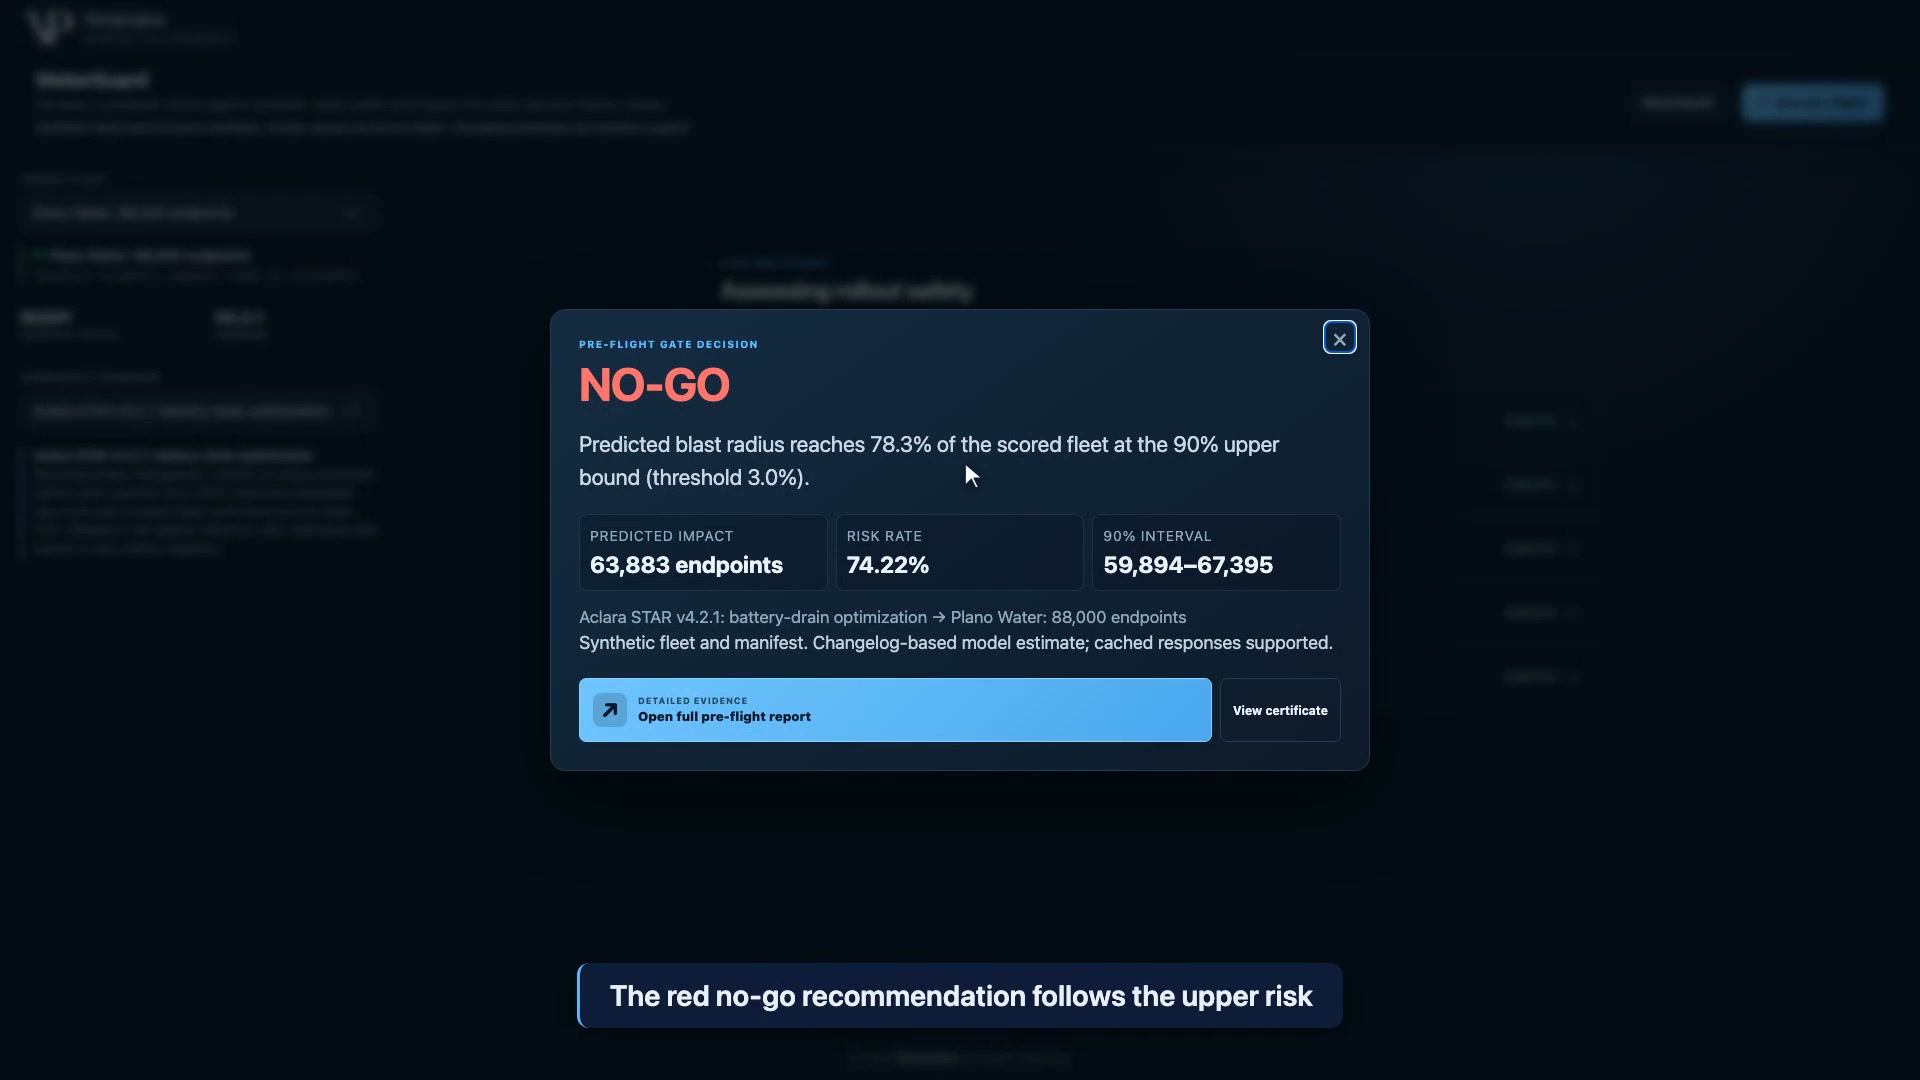
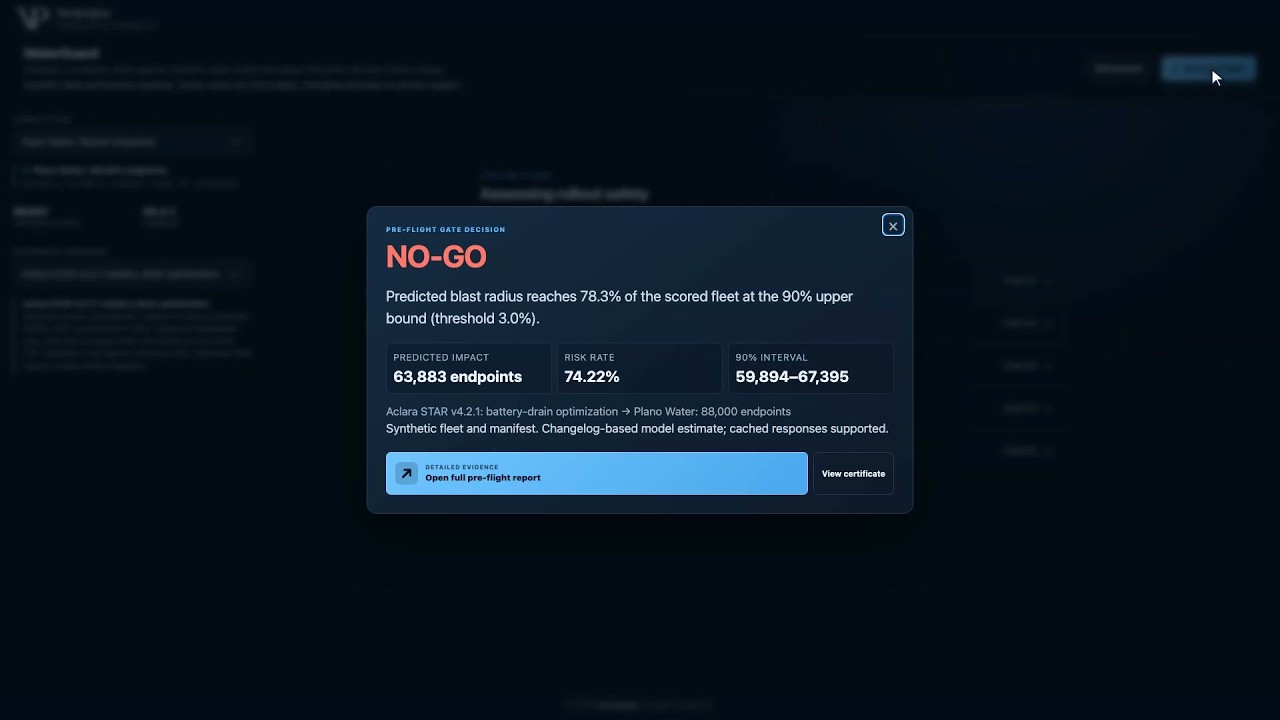
Initial synthetic Plano result: NO-GO, 63,883 modeled failures, 74.22% and a 59,894 to 67,395 count interval.
Initial synthetic Plano case: 63,883 predicted failures among 86,078 scored endpoints, a 74.22% mean rate and a 59,894 to 67,395 modeled count interval. The upper rate is 78.30%; another 1,922 endpoints are excluded. Open the image for full-size inspection.

2. Compare the upper interval with the declared boundary

The initial candidate predicts 63,883 failures, or 74.22% of scored endpoints. The hotfix lowers the prediction to 2,449, or 2.85%. That is a large modeled improvement, but the gate checks the upper interval first: 3,531 divided by 86,078 is about 4.10%, still above the configured 3.0% hard block. It therefore returns NO-GO, even though the mean is below 3.0%.
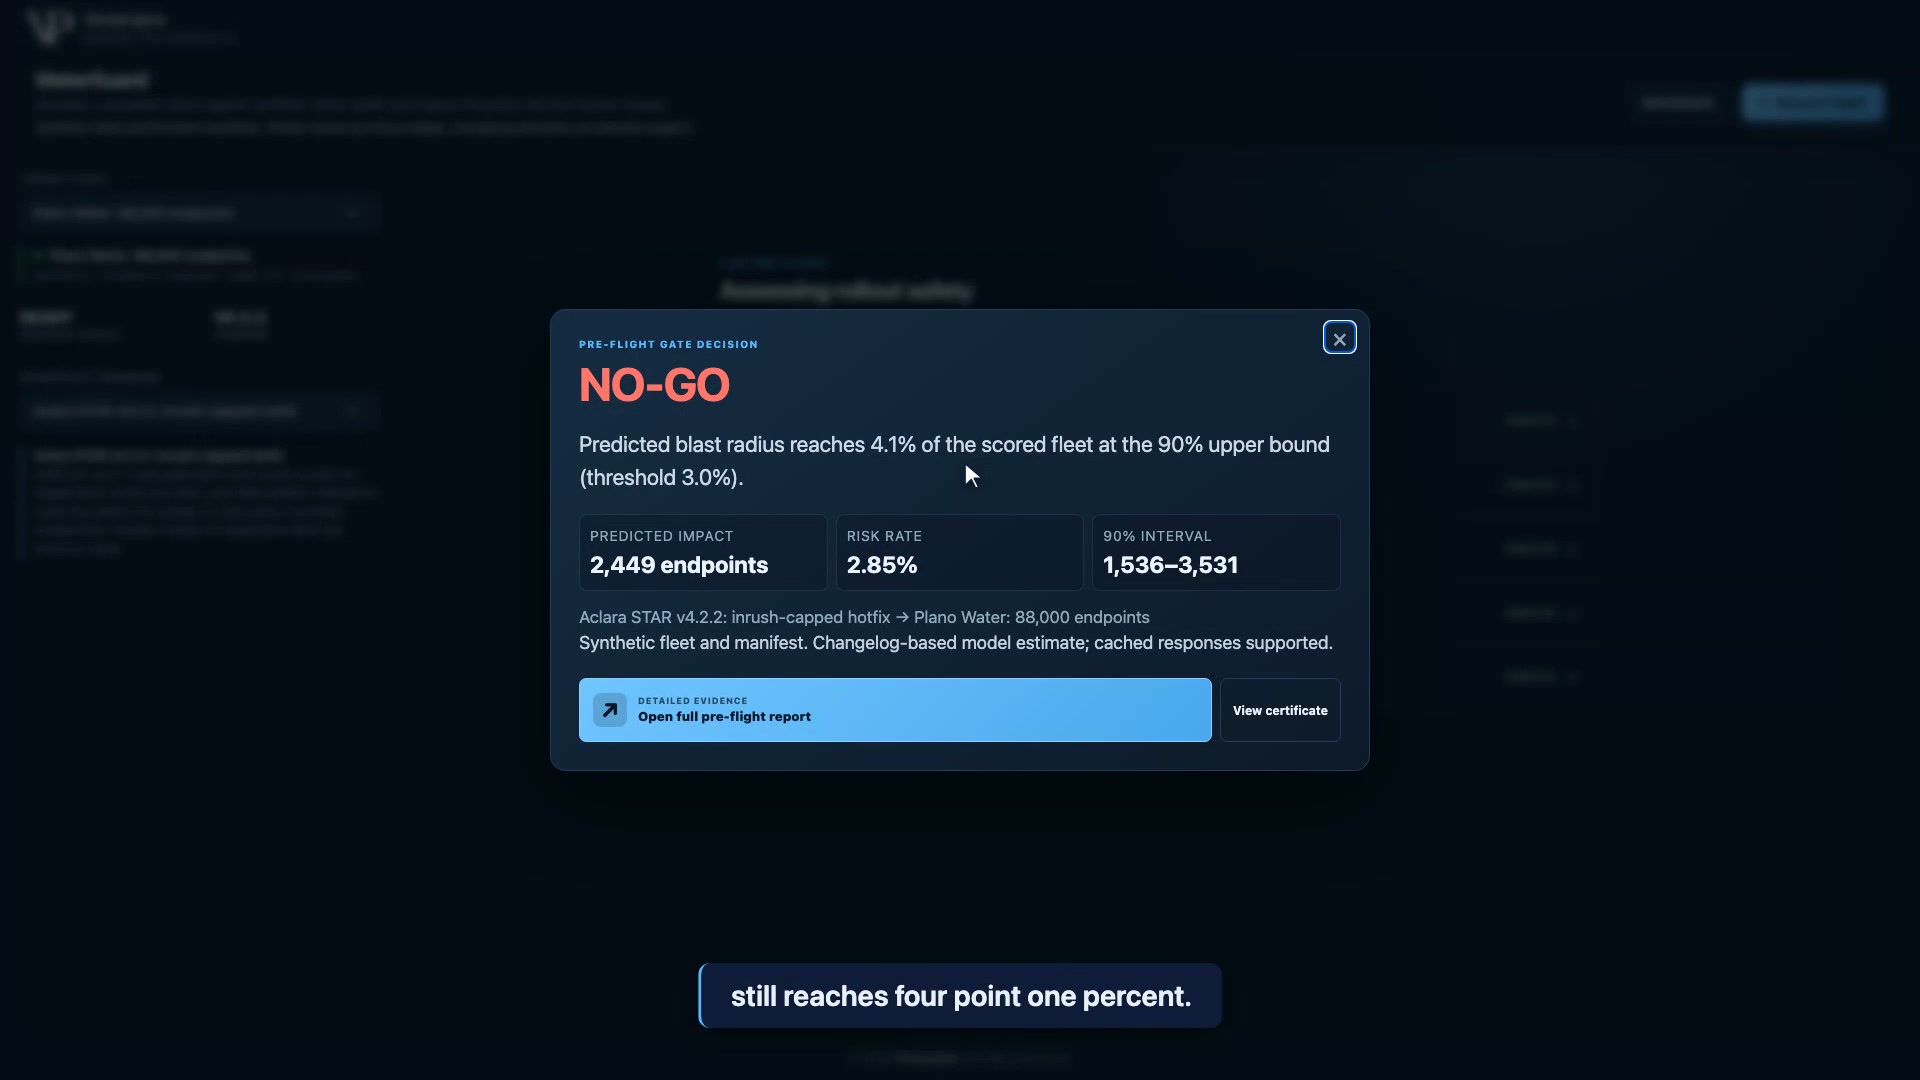
MeterGuard NO-GO modal for a synthetic Plano hotfix: 2,449 predicted failures, 2.85% scored rate and a 1,536 to 3,531 modeled interval.
Synthetic Plano hotfix: 2,449 predicted failures among 86,078 scored endpoints, with a 1,536 to 3,531 modeled count interval. Its 4.10% upper rate triggers NO-GO at the 3.0% boundary; 1,922 endpoints remain excluded and recommended for manual review. Open the image for full-size inspection.

The 90% modeled count interval runs from 1,536 to 3,531 for the hotfix. It describes the spread of simulated outcomes under these inputs, not a guaranteed field range. The practical review distinction is between “better than the earlier candidate” and “inside the declared release boundary”; this example satisfies only the first.

3. Keep the behavior profile, change the population

The same hotfix behavioral estimate produces GO on the generated Hill Country Electric Co-op population. Its median battery charge is 83.5%, median age is 2.8 years and weak radio signal accounts for 2.3%, compared with Plano's 69.0%, 4.4 years and 13.4%. The comparison shows why a firmware estimate cannot be separated from the condition of the population being scored.
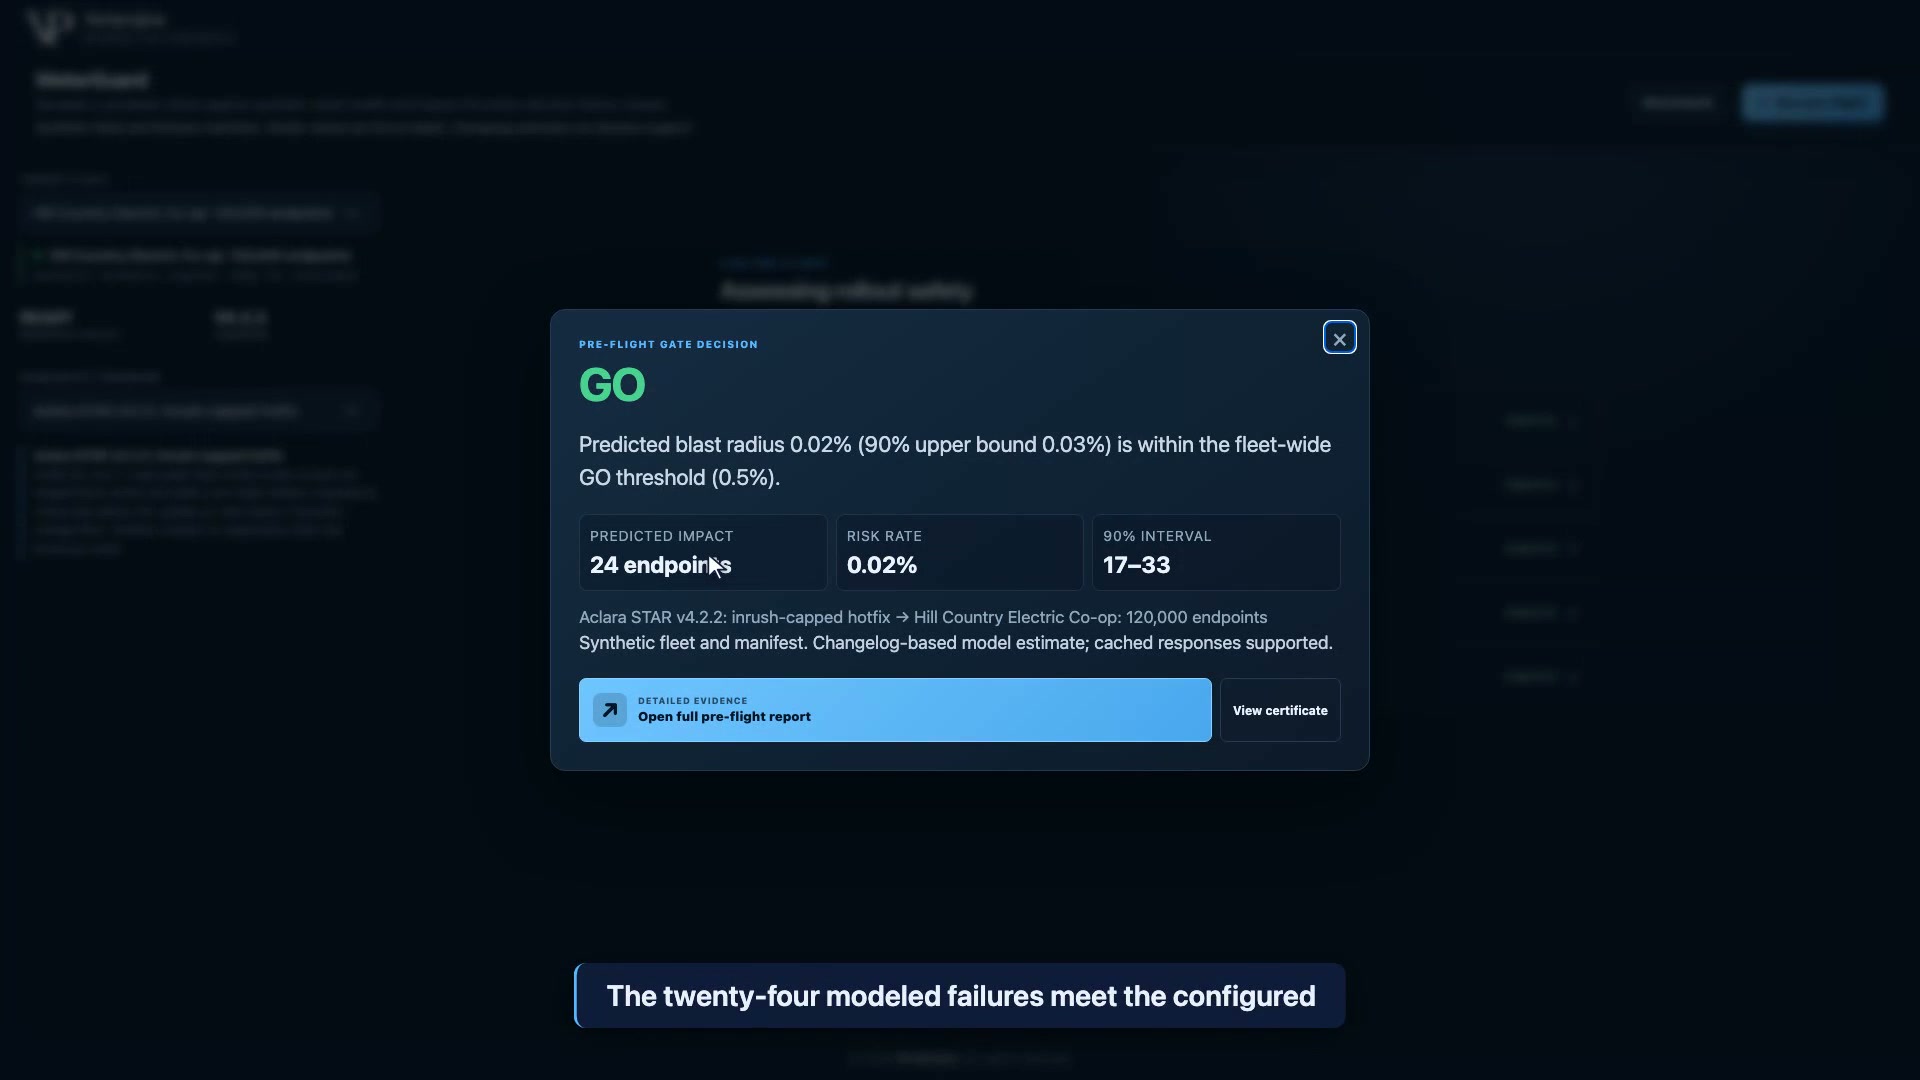
Synthetic co-op hotfix result: GO, 24 modeled failures, 0.02% and a 17 to 33 count interval.
The same cached hotfix behavioral profile on the synthetic co-op population produces GO for 118,222 scored endpoints: 24 modeled failures, a 17 to 33 count interval and a 0.03% upper rate. The 1,778 excluded endpoints are not covered. This does not establish cross-vendor firmware compatibility or a completed release. Open the image for full-size inspection.
Current recorded recommendations, with denominators and uncertainty attached
Synthetic caseScored / excludedMean modeled failures90% count intervalUpper rateVerdict
Plano, initial manifest86,078 / 1,92263,883 (74.22%)59,894 to 67,39578.30%NO-GO
Plano, hotfix86,078 / 1,9222,449 (2.85%)1,536 to 3,5314.10%NO-GO
Co-op, same hotfix profile118,222 / 1,77824 (0.02%)17 to 330.03%GO for scored endpoints
Co-op, thin manifest118,222 / 1,77854 (0.05%)39 to 750.06%STAGED-CANARY

GO does not cover the 1,778 excluded co-op endpoints, authorize an OTA job or demonstrate that the same image is compatible with different vendors' hardware. We are comparing estimated write behavior across generated health distributions, not deploying an image across manufacturers.

4. A small estimate cannot replace adequate firmware evidence

The thin-manifest case on the co-op population predicts only 54 failures, with a 39 to 75 count interval and a 0.06% upper rate. Its profile confidence is low, so the second policy branch prevents GO and recommends STAGED-CANARY. This is a different profile: recovery probability is 0.50 and write amplification is 0.008, rather than the hotfix's 0.96 and 0.004.
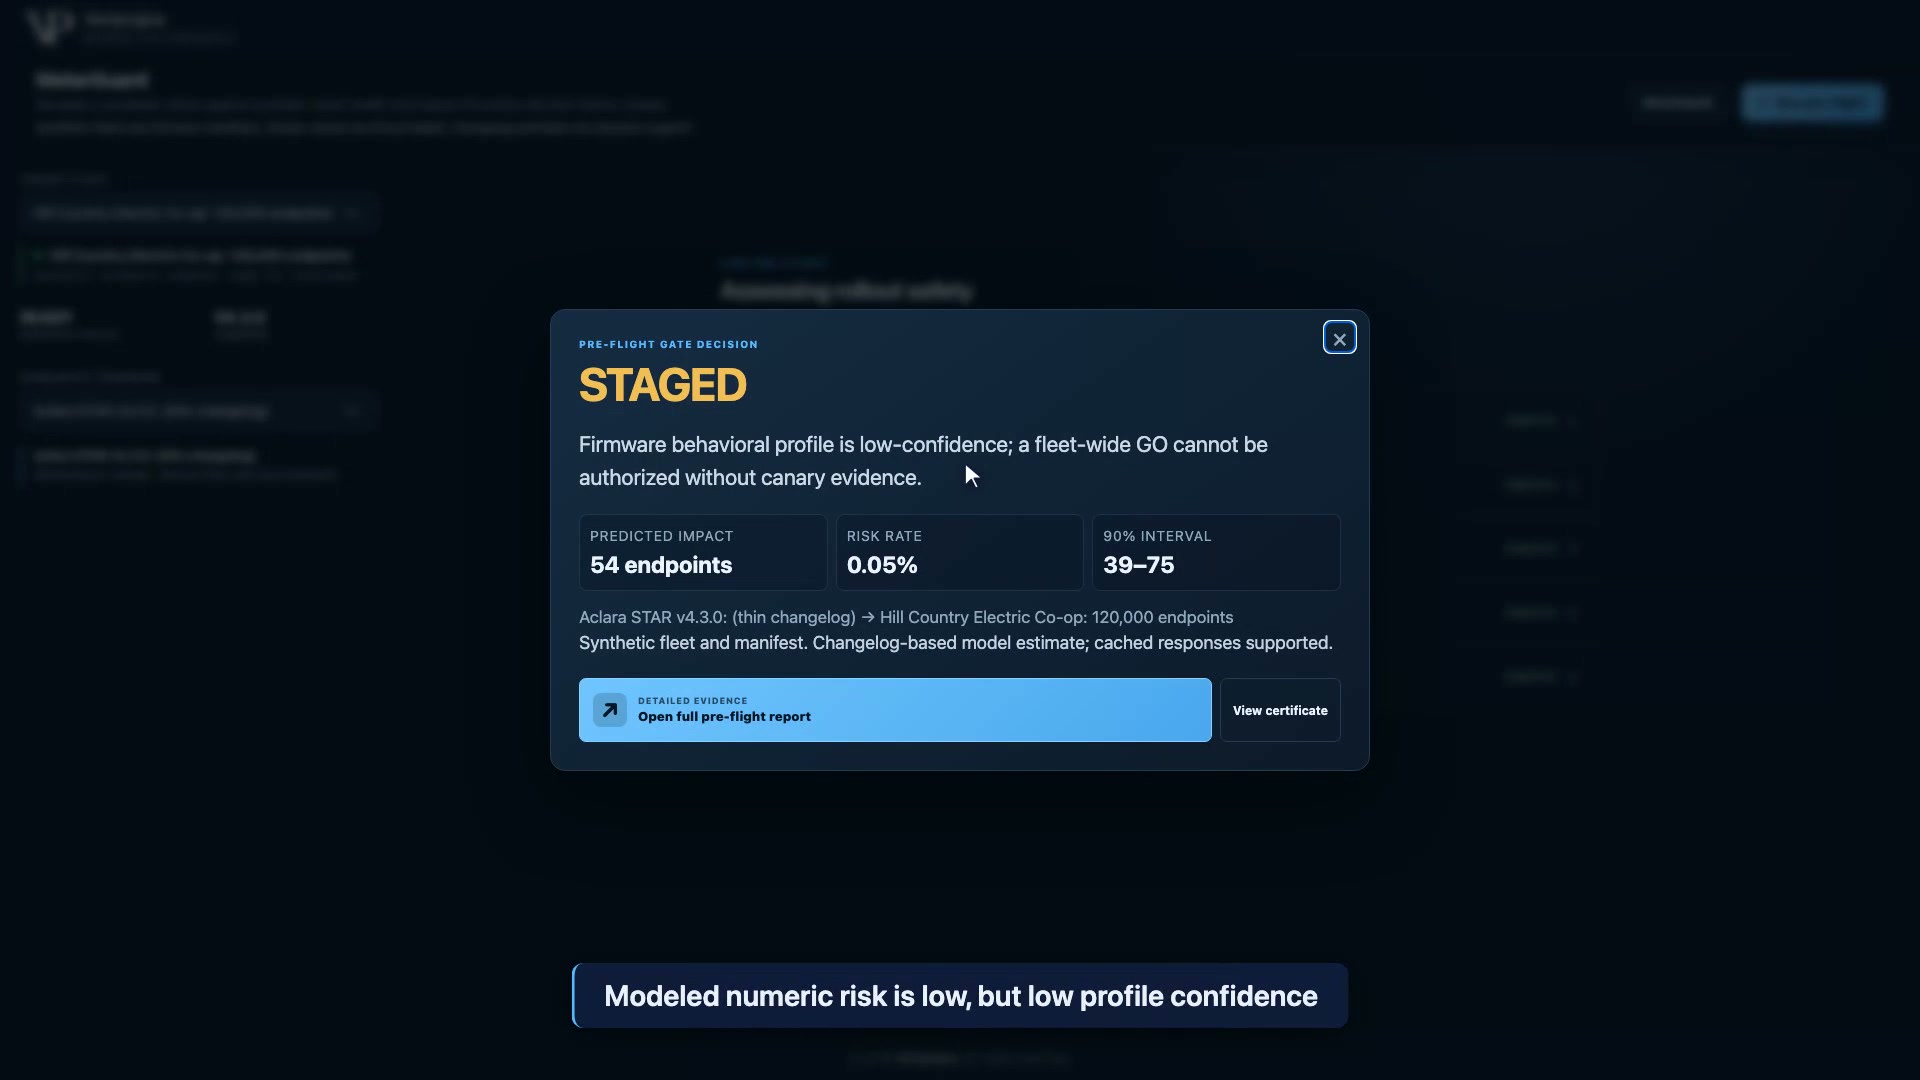
MeterGuard STAGED modal for a synthetic co-op thin manifest: 54 modeled failures and a low-confidence profile that prevents GO.
Synthetic co-op thin-manifest case: 54 modeled failures among 118,222 scored endpoints, with a 39 to 75 count interval and a 0.06% upper rate. Low profile confidence produces STAGED-CANARY, shown as STAGED in the modal. The 1,778 excluded endpoints, proposed canary and manual review remain unresolved; no canary or review is executed. Open the image for full-size inspection.

The non-GO recommendation proposes a 500-endpoint lowest-modeled-risk cohort, a 72-hour hold and fresh observed telemetry before widening; the configured observed failure-rate condition is below 0.1%. The app does not execute that canary. Nor does a healthy selected cohort establish that the degraded or excluded population is safe.

5. Preserve the exclusions and the basis of the decision

The initial-case HTML record below shows how the recommendation retains the synthetic snapshot, cohort breakdown, exclusions and advisory memo. The 1,922 missing-telemetry endpoints remain outside the prediction denominator and recommended for manual review. Exporting the record does not complete that review or silently count them as healthy.
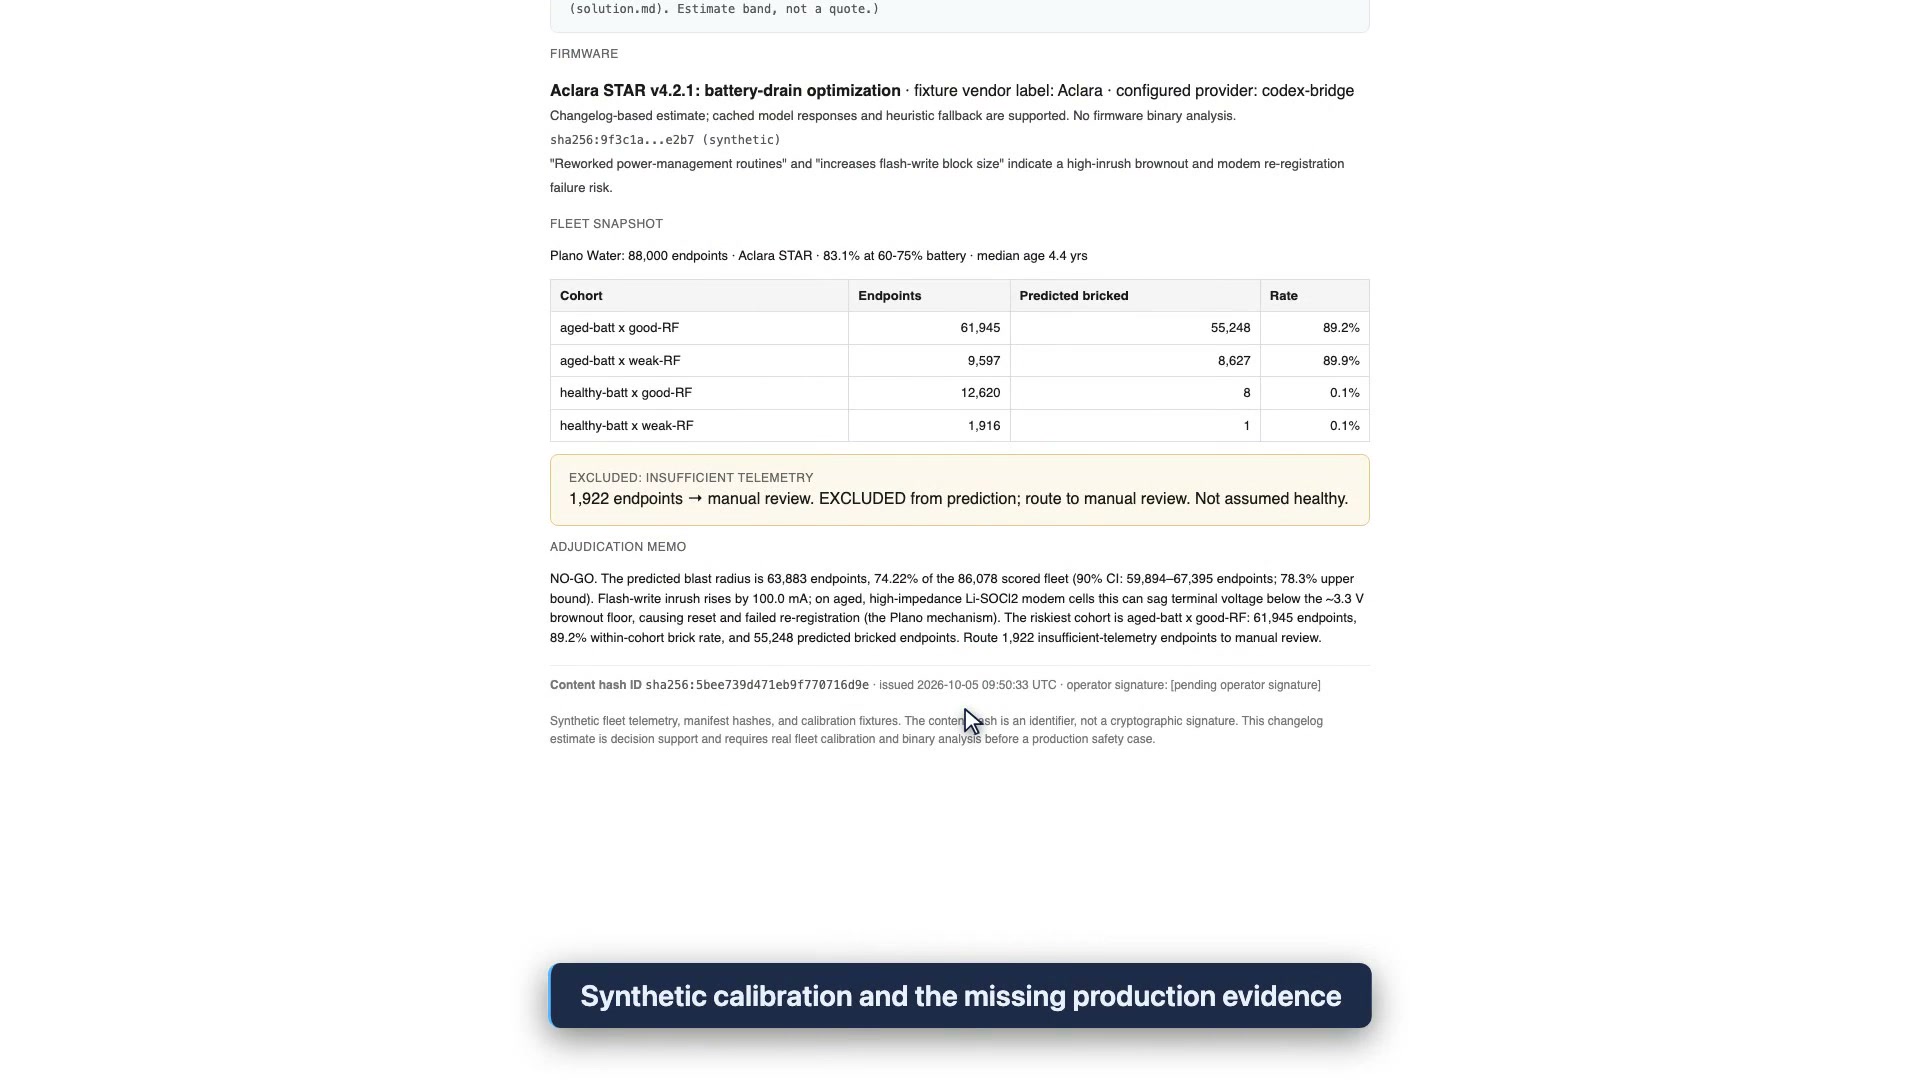
Generated initial-case decision record showing synthetic fleet cohorts, 1,922 excluded endpoints and a pending operator signature.
The exported record is for the initial synthetic Plano STAR v4.2.1 case, not the hotfix. It retains the cohort breakdown, 1,922 exclusions, advisory memo, timestamp and pending signer. The content-hash identifier is not a cryptographic signature, and the firmware hash is synthetic. Any visible cost wording uses assumed estimates, not a quote or verified savings. Open the image for full-size inspection.

The export also retains profile inputs, prediction and interval, policy thresholds, seed and timestamp. Its identifier is a truncated SHA-256 content hash; the operator signer is pending and the firmware hash is a synthetic placeholder. These fields make the generated decision inspectable, but do not make it a signed approval, compliance certificate or immutable audit archive.

Read the benchmark without hiding the control that needs review

The completed screen combines three measurements from a fixed 120-scenario synthetic evaluation with two current-profile regression controls. Each evaluation scenario uses 20,000 fully observed generated endpoints and 80 simulator iterations, with seed 2026. Generated truth comes from the same assumed mechanism with fresh noise, not an independent utility dataset.
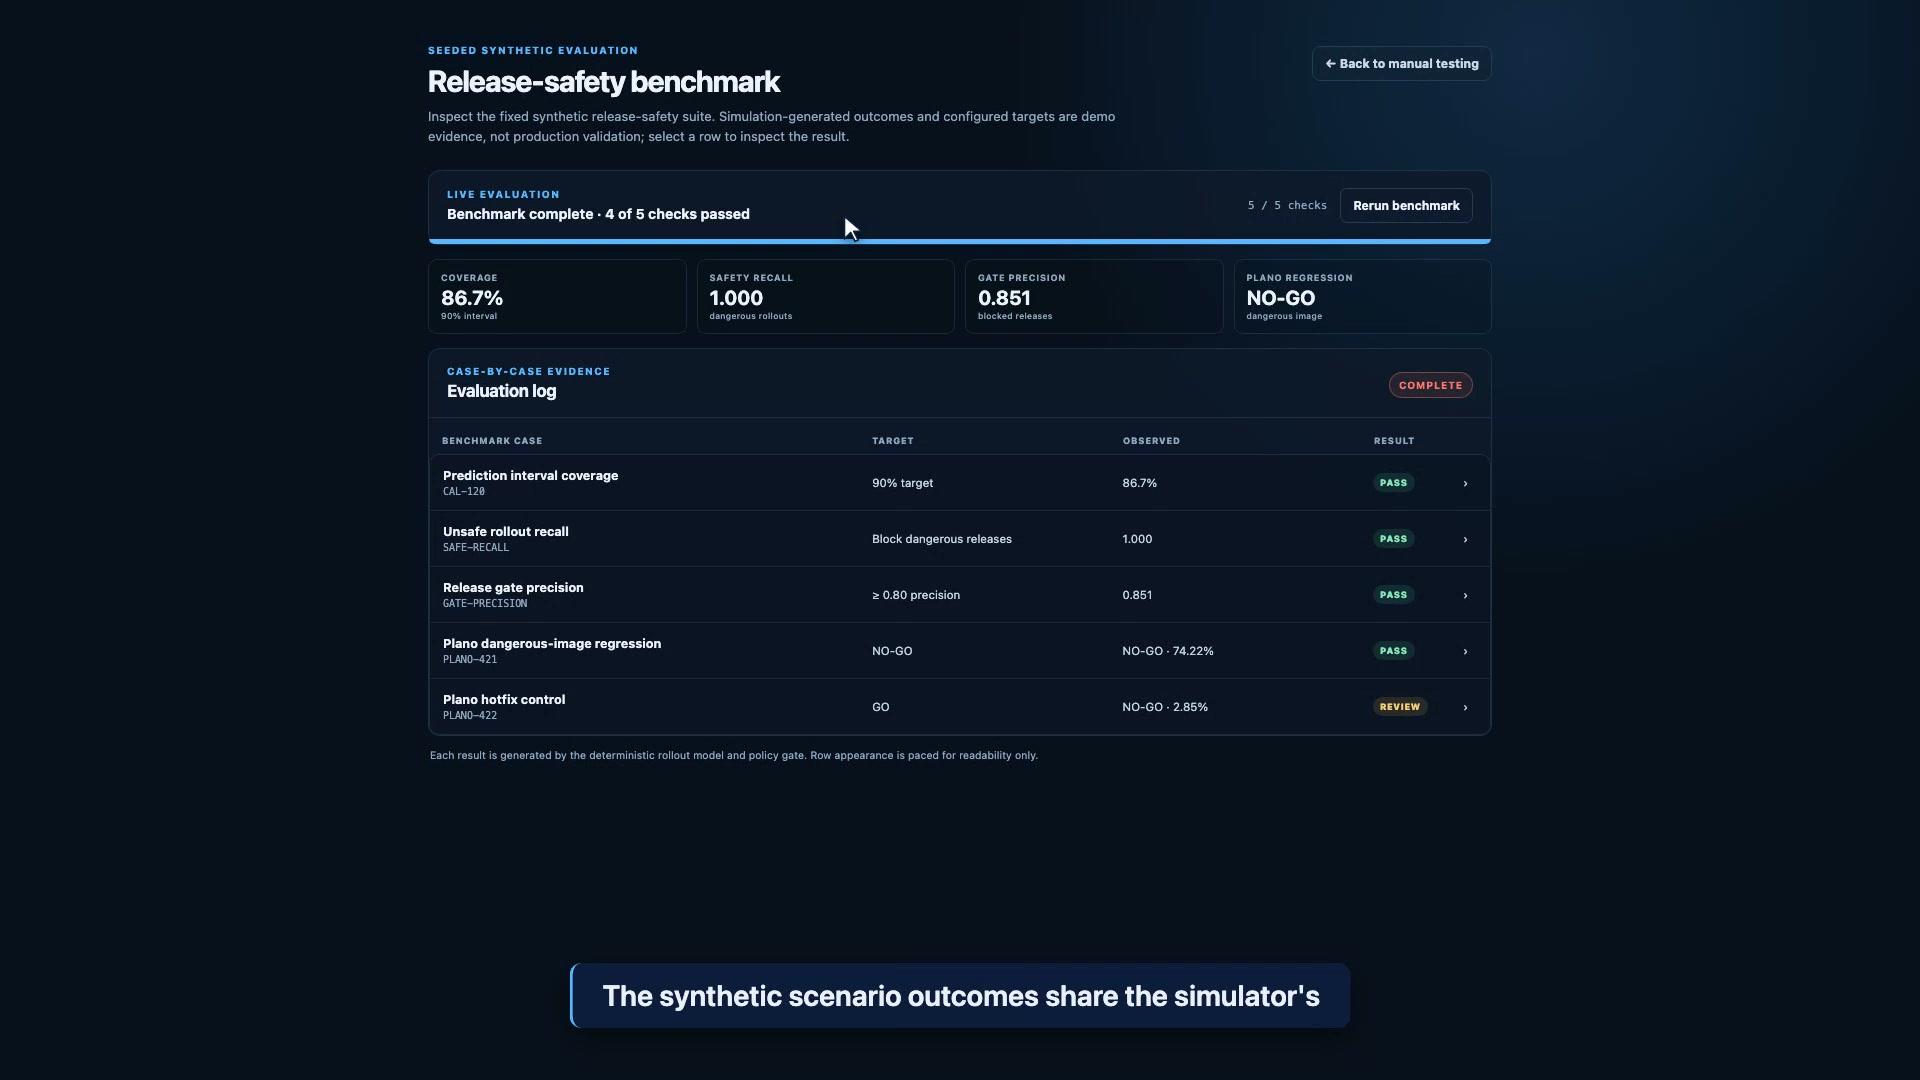
MeterGuard completed benchmark with coverage 86.7%, recall 1.000, precision 0.851, four passing checks and one hotfix control requiring review.
The current five-check synthetic suite has four passing checks and one requiring review: the hotfix receives NO-GO against its configured GO target. The nominal 90% interval covers 86.7% of generated outcomes; PASS uses an 80% configured floor, not achievement of 90% coverage. Open the image for full-size inspection.
Five current checks and their bounded interpretation
CheckObserved resultScope and interpretation
Interval coverage86.7%, PASSNominal 90% interval; configured pass floor is 80%. The nominal target is not met.
Unsafe-rollout recall74/74 = 1.000, PASSAll 74 scenarios labelled dangerous are blocked in this fixed run; configured floor is 0.95.
Release-gate precision74/87 = 0.851, PASS74 of 87 blocked scenarios are labelled dangerous; configured floor is 0.80.
Initial Plano regressionNO-GO, PASSThe current initial profile meets its configured NO-GO target.
Plano hotfix controlNO-GO, REVIEWThe current hotfix does not meet its configured GO target.

Danger is labelled as a generated failure rate above 1.0%; both NO-GO and STAGED-CANARY count as blocked. The evaluation records 74 true positives, 13 false positives, 33 true negatives and zero false negatives within this fixed synthetic run. Four passing checks and one requiring review expose an input-sensitive mismatch; they do not establish perfect accuracy, independent validation or universal prevention.
Where this demonstration fits in a rollout workflow

MeterGuard helps inspect a proposed decision: estimated behavior, population assumptions, uncertainty, exclusions and the policy used. The table separates demonstrated evidence from the work a production deployment would still require.

Decision needThis demo showsProduction evidence still needed
Firmware behaviorChangelog-derived model estimates, caching and fallbackBinary-derived or measured behavior validated on relevant hardware
Fleet conditionGenerated battery, radio and flash-wear distributionsReal telemetry, data quality checks and utility-specific calibration
Release controlExplicit GO / NO-GO / STAGED-CANARY recommendationsIntegration with authorized release controls and observed canary results
Decision recordHTML/JSON export preserving inputs and exclusionsOperator approval, signatures and applicable compliance assessment

What this demo does NOT do

It does not connect to a real AMI feed, analyze firmware binaries, release or block an OTA job, execute a canary or complete manual review. Fleets, manifests and roster entries are synthetic. The exported certificate has a pending signer and a content-hash identifier; it is not a signed approval or compliance certification.

Questions before a firmware rollout

How do I assess smart meter firmware risk before a rollout?

MeterGuard demonstrates a pre-flight that combines an estimated firmware behavior profile with a synthetic fleet health snapshot. It models failures, reports an uncertainty interval and applies a declared release policy. Production assessment still needs real telemetry, validated firmware behavior and calibration against utility campaign outcomes.

Why does the hotfix still get a NO-GO?

On the synthetic Plano fleet, the hotfix lowers predicted failures to 2,449 of 86,078 scored endpoints, or 2.85%. Its upper modeled interval rate is 4.10%, which exceeds the configured 3.0% hard-block boundary. A lower mean does not satisfy that boundary.

What happens to meters with missing telemetry?

Endpoints missing telemetry are excluded from the modeled failure rate and recommended for manual review. The synthetic Plano example excludes 1,922 endpoints from a population of 88,000. The app does not complete that review or assume those endpoints are healthy.

Can the AI override the release decision?

The governance memo is written after the deterministic policy gate issues its recommendation and cannot directly override it. The model-assisted firmware profile still supplies simulation inputs, so inaccurate estimates can change the verdict. A coded rule makes the decision inspectable without validating the profile.

Does MeterGuard connect to our AMI system or install firmware?

This demo uses synthetic fleets and firmware manifests, with no live advanced metering infrastructure (AMI) feed or executed over-the-air release. A GO is a modeled recommendation for scored endpoints, not installation approval or evidence of hardware compatibility. Integration with real telemetry and release controls is prospective work.

Is the exported certificate a signed approval?

The export records the inputs, prediction, exclusions and policy used for the recommendation. Its identifier is a truncated content hash and the operator signature is pending. It is an inspectable decision record, not a digitally signed approval or compliance certificate.

Technical Research

Explore related research for broader context on this demonstration.

Define the evidence your release decision needs

Discuss a pre-flight workflow for your utility and firmware environment.

We can scope the telemetry, behavior validation and policy integration needed to move from this synthetic demonstration toward a production assessment.

Pre-flight evidence assessment

  • ✓ Fleet telemetry and exclusion criteria
  • ✓ Firmware behavior assumptions
  • ✓ Risk boundaries and uncertainty
  • ✓ Operator approval requirements

Production integration scope

  • ✓ Real telemetry interfaces
  • ✓ Hardware behavior validation
  • ✓ Campaign outcome calibration
  • ✓ Release-control integration