The analytics layer between detection and prescription

A satellite tells you a field is stressed. SpectraRx tells you what is wrong, why, and what to apply.

In this physics-grounded synthetic demo for one crop and geography, NDVI can flag nitrogen, water, and fungal stress with the same amber. SpectraRx reads the full 424-band curve at every pixel, names the cause, writes a variable-rate prescription at real boom geometry, and generates an IPM-style record template for review. Pixels that cannot be supported route uncertainty to scouting.

0.887

Macro-F1 separating stress types

424-band spectral CNN vs 0.69 Sentinel-2 incumbent, on a 1,280-pixel held-out set

424 bands

Full VNIR and SWIR curve per pixel

400 to 2515 nm across the visible, near-infrared, and shortwave-infrared

0.887 to 0.373

Accuracy without atmospheric correction

Calibration is load-bearing, measured in-app

This is a runnable demo. The hyperspectral scenes are physics-grounded synthetic cubes, and live sensor and farm-machinery connectors are not implemented. The trained classifier, deterministic gates, export formats, and generated IPM-style record template run exactly as shown.

A "stressed" alert with no cause is not a decision

The gap between detecting a problem and doing something about it.

Multispectral monitoring and NDVI can paint a large corn block amber and call it stressed. They do not identify the cause. Nitrogen shortfall, water deficit, and early fungal infection require different responses, while the stress alert gives the operator one color for all of them.

The cost of guessing is operational. A wrong diagnosis spends a pass on the wrong problem, while a missed disease signal narrows the time to act. A single amber blob localizes none of that.

The honest fix is not a prettier heat map. It is an analytics layer that reads the physics of the crop, separates the causes, and routes high-abstention zones to scouting when the underlying data cannot be trusted. That is the layer we built.

How SpectraRx works

A deterministic chain: acquire, calibrate, diagnose, gate, prescribe, record. The classifier proposes a diagnosis; code decides whether it is safe to act on.

Each scene is a hyperspectral cube of 424 bands spanning 400 to 2515 nm across the visible, near-infrared, and shortwave-infrared. An empirical-line atmospheric correction recovers bottom-of-atmosphere surface reflectance from top-of-atmosphere radiance and stamps a calibration-provenance flag per scene. A custom 1-D spectral CNN, written from scratch in pure numpy with real convolution, backpropagation, and Adam, classifies each pixel's full curve into healthy, nitrogen deficiency, water stress, or early tar spot, temperature-scaled so its confidence is calibrated. A narrowband physics-feature model and the real Sentinel-2 broadband incumbent run alongside as baselines.

Three gates that sit outside the model

Trust never depends on the model's own confidence report. Before any pixel becomes a prescription, it passes three deterministic checks.

1. Calibration provenance

Atmospheric correction stamps a per-scene provenance flag. In the deliberate skip mode, raw top-of-atmosphere data reaches the classifier so the downstream confidence and physics-agreement gates can expose the failure path.

2. Confidence and ambiguity

Low-confidence or mixed-signature pixels abstain rather than force a class. Zones at or above 34 percent abstained pixels route to scouting; other zones use their non-abstained majority for the prescription.

3. Physics agreement

If the CNN claims a class but the documented physical feature disagrees (it says nitrogen, but the red-edge did not shift), the pixel abstains. A claim has to match the spectroscopy.

From diagnosis to a boom-ready plan and a reviewable record template

The typed diagnosis map is aggregated from 5 m pixels to 25 m management cells using a 27 m boom profile. Equipment geometry is part of the calculation, not an afterthought. Agronomic rates follow the configured diagnosis rules, including a fungicide rule that permits action only inside the configured R3 window. The plan exports as ISO-XML and GeoJSON.

The demo then generates an EU Farm to Fork IPM-style record template from the diagnosis and prescription for agronomist and compliance review. It does not offer a live regulatory filing or connector. The one place a language model is allowed to touch this pipeline is rendering that justification prose from already-computed facts, and it defaults to a templated fallback so the demo runs with no API key.

The amber blob, worked end to end

The demo's physics-grounded synthetic scene. Every image below is a screenshot of the running app.

One color for three different problems

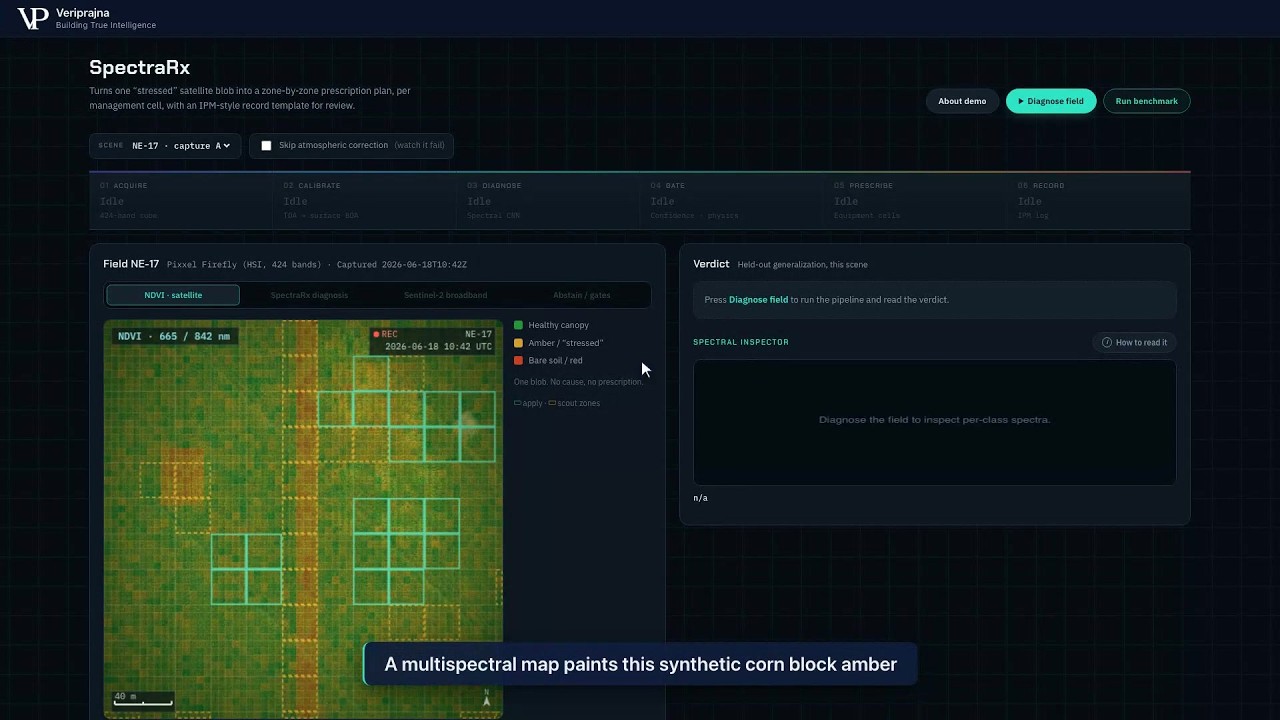
The NDVI tab shows the field the way a satellite monitoring service delivers it: one amber region in the northeast quarter, labeled stressed, with no cause and no prescription. This is the starting point every precision-ag team already has, and the point where the decision stalls.
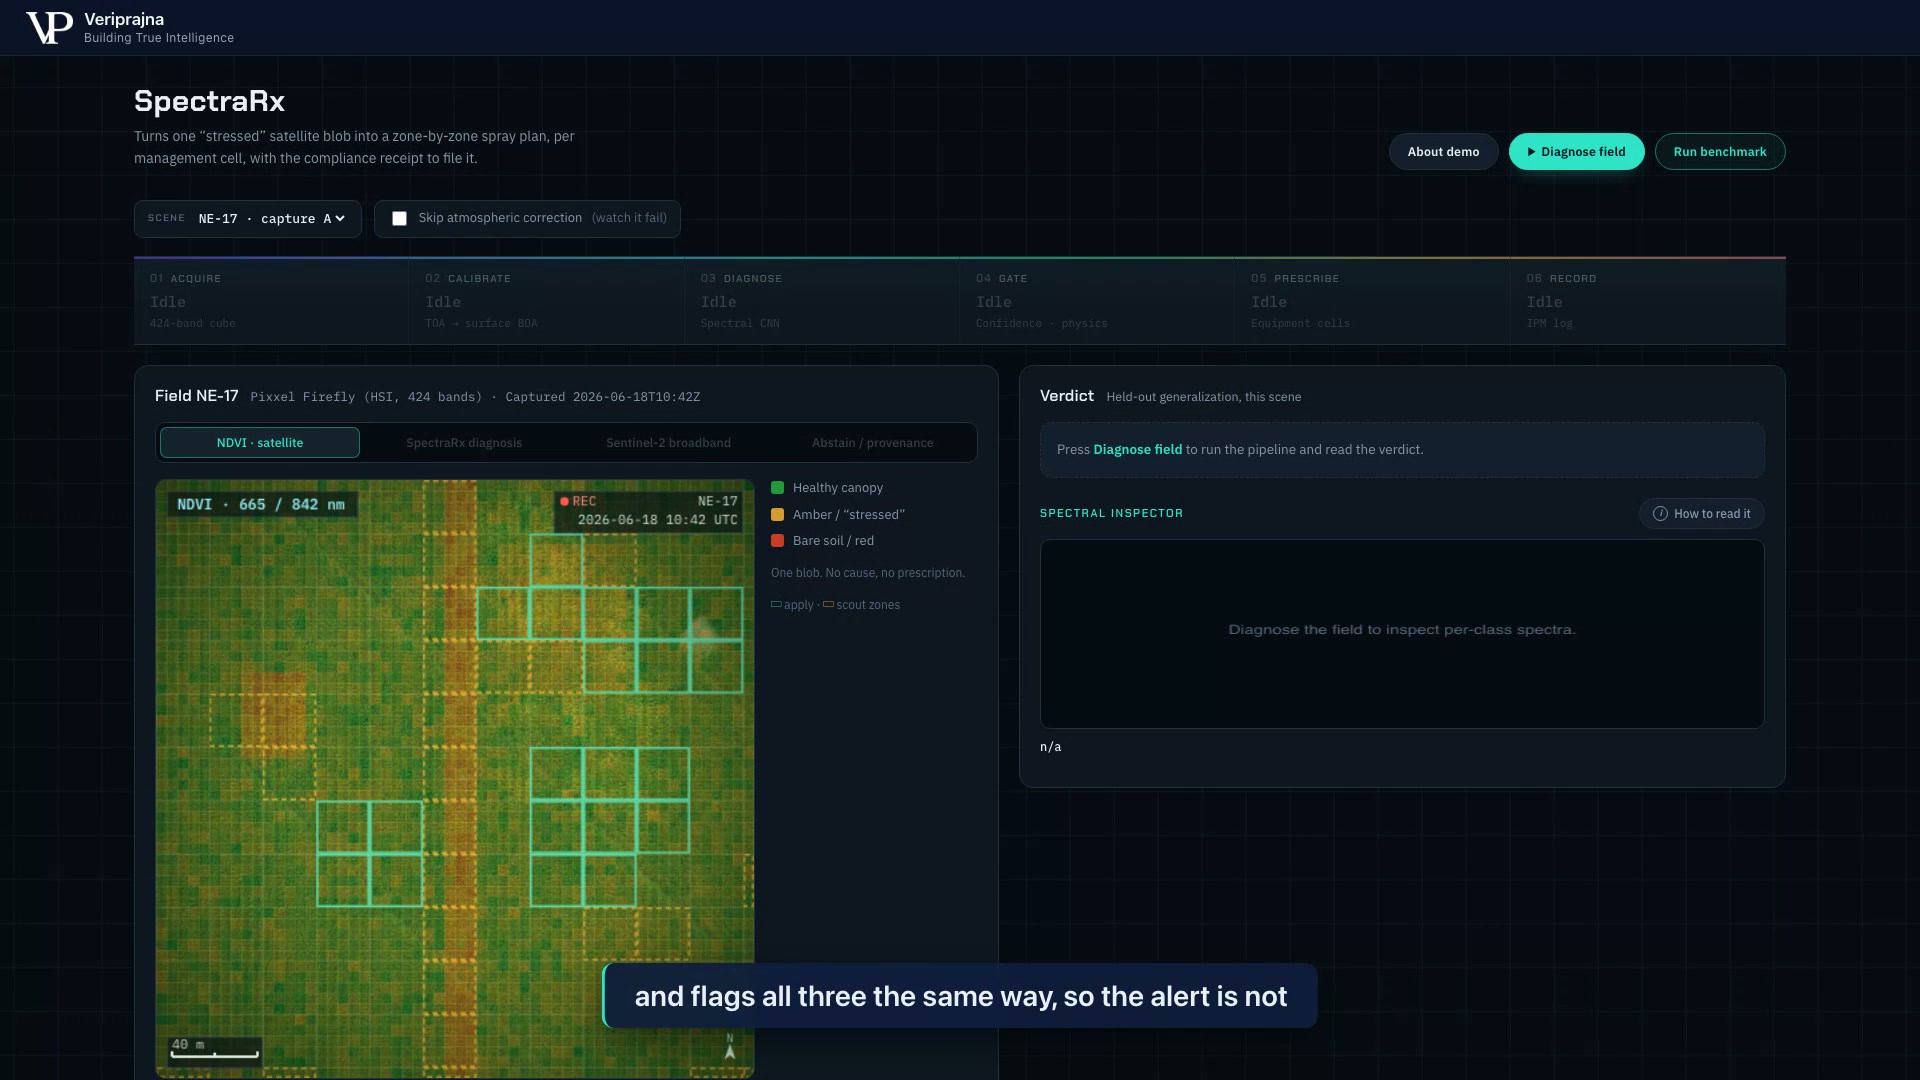
The NDVI satellite tab showing one amber stressed region with the caption one blob, no cause, no prescription, and the verdict panel still idle.
The NDVI view: one amber blob, no cause, no prescription.

The blob resolves into typed zones

Running Diagnose field splits that single amber region into distinct causes: nitrogen deficiency in amber, water stress in blue, and early tar spot in red, with hatched pixels abstained and routed to ground-truth scouting. On this held-out physics-grounded synthetic scene, the verdict panel reports macro-F1 0.89 for SpectraRx against 0.69 for the Sentinel-2 incumbent, calibrated accuracy 0.89, and 20.1 percent of the field abstained. One map becomes three different jobs.
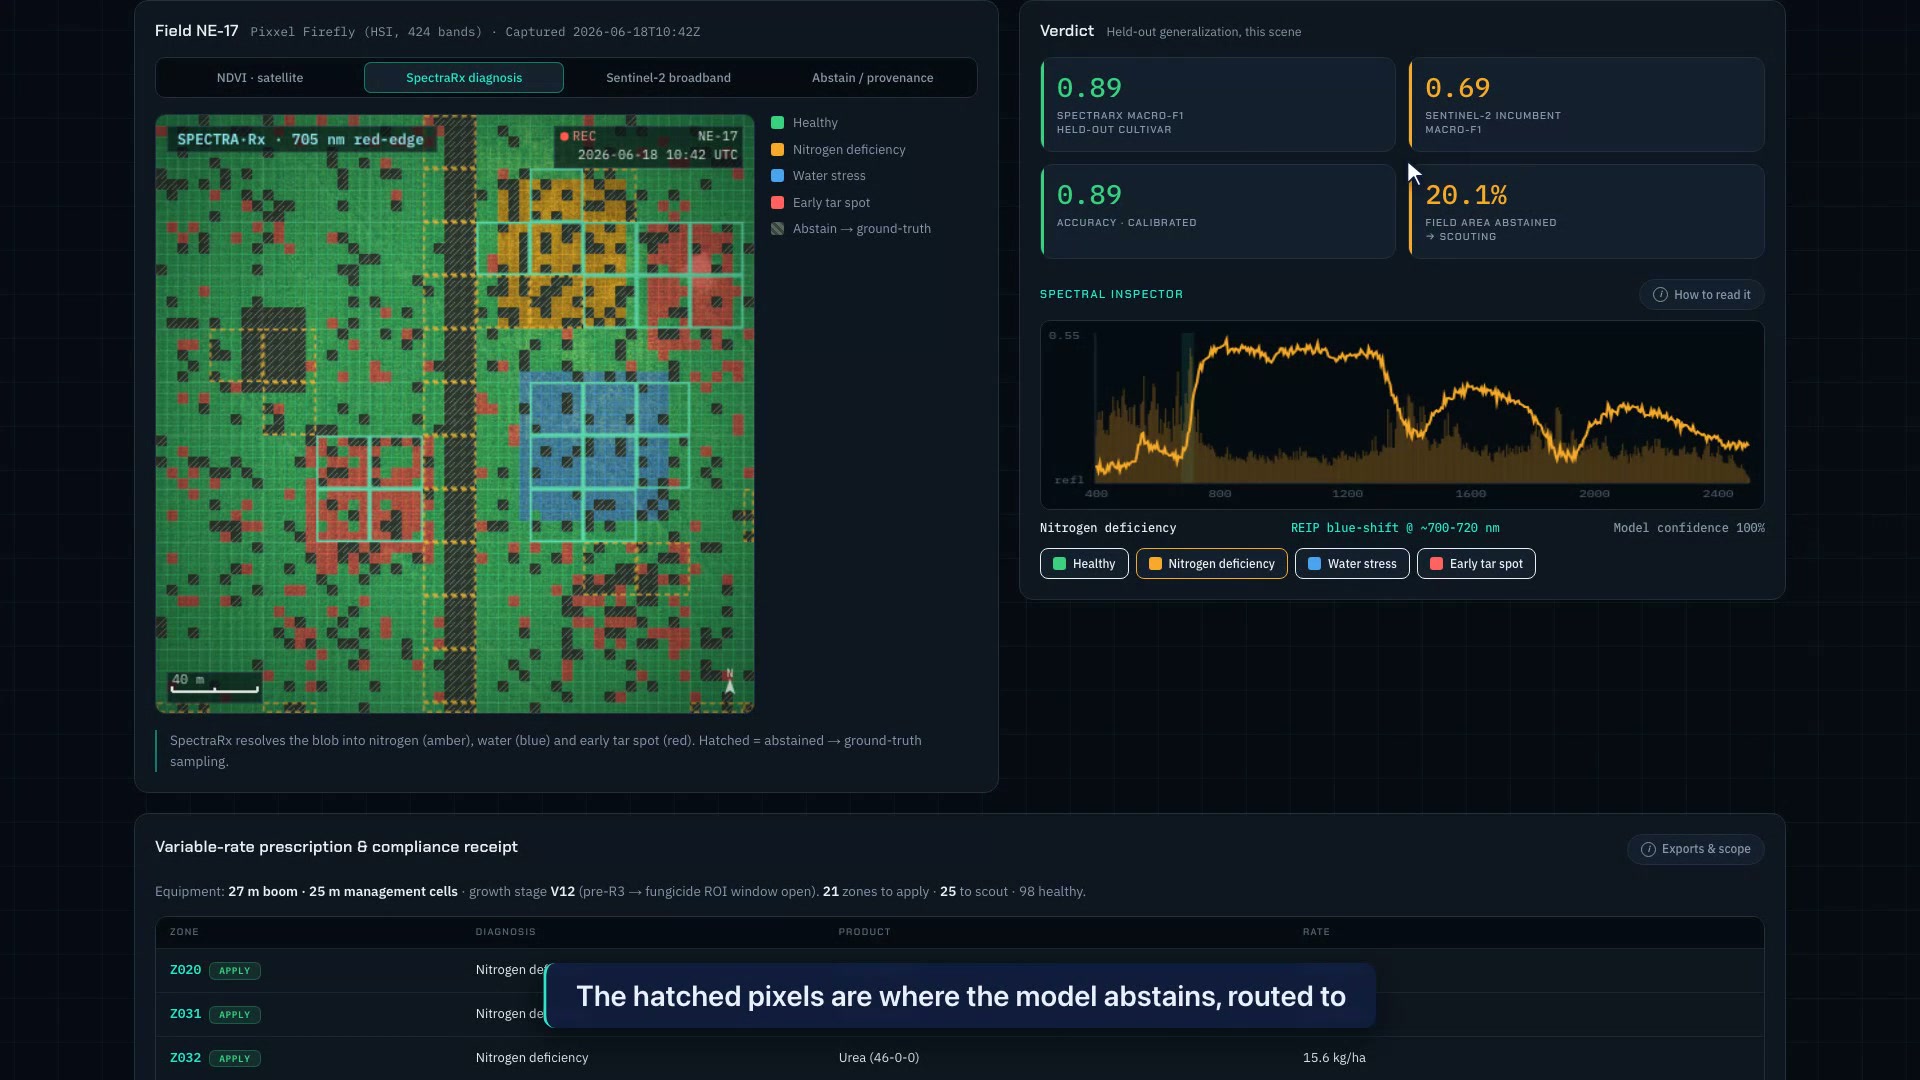
SpectraRx diagnosis view: the amber blob resolved into nitrogen (amber), water (blue), and early tar spot (red) zones with hatched abstained pixels, and a verdict panel reading SpectraRx macro-F1 0.89, Sentinel-2 0.69, and 20.1 percent field area abstained.
The diagnosis: nitrogen (amber), water (blue), tar spot (red), and abstained (hatched) zones, with the held-out verdict.

The model reads the physics, not the data

The obvious objection to any crop classifier is that it learned the shape of its own training data. The spectral inspector answers part of that question directly. For tar spot, the independently computed band-saliency trace peaks in the sampled 530 and 535 nm bins nearest the PRI diagnostic near 531 nm. For nitrogen it weights the 680 to 720 nm red-edge. The system separately checks documented 970, 1450, and 1940 nm SWIR water diagnostics; those checks are not presented as the CNN's highest saliency peaks.
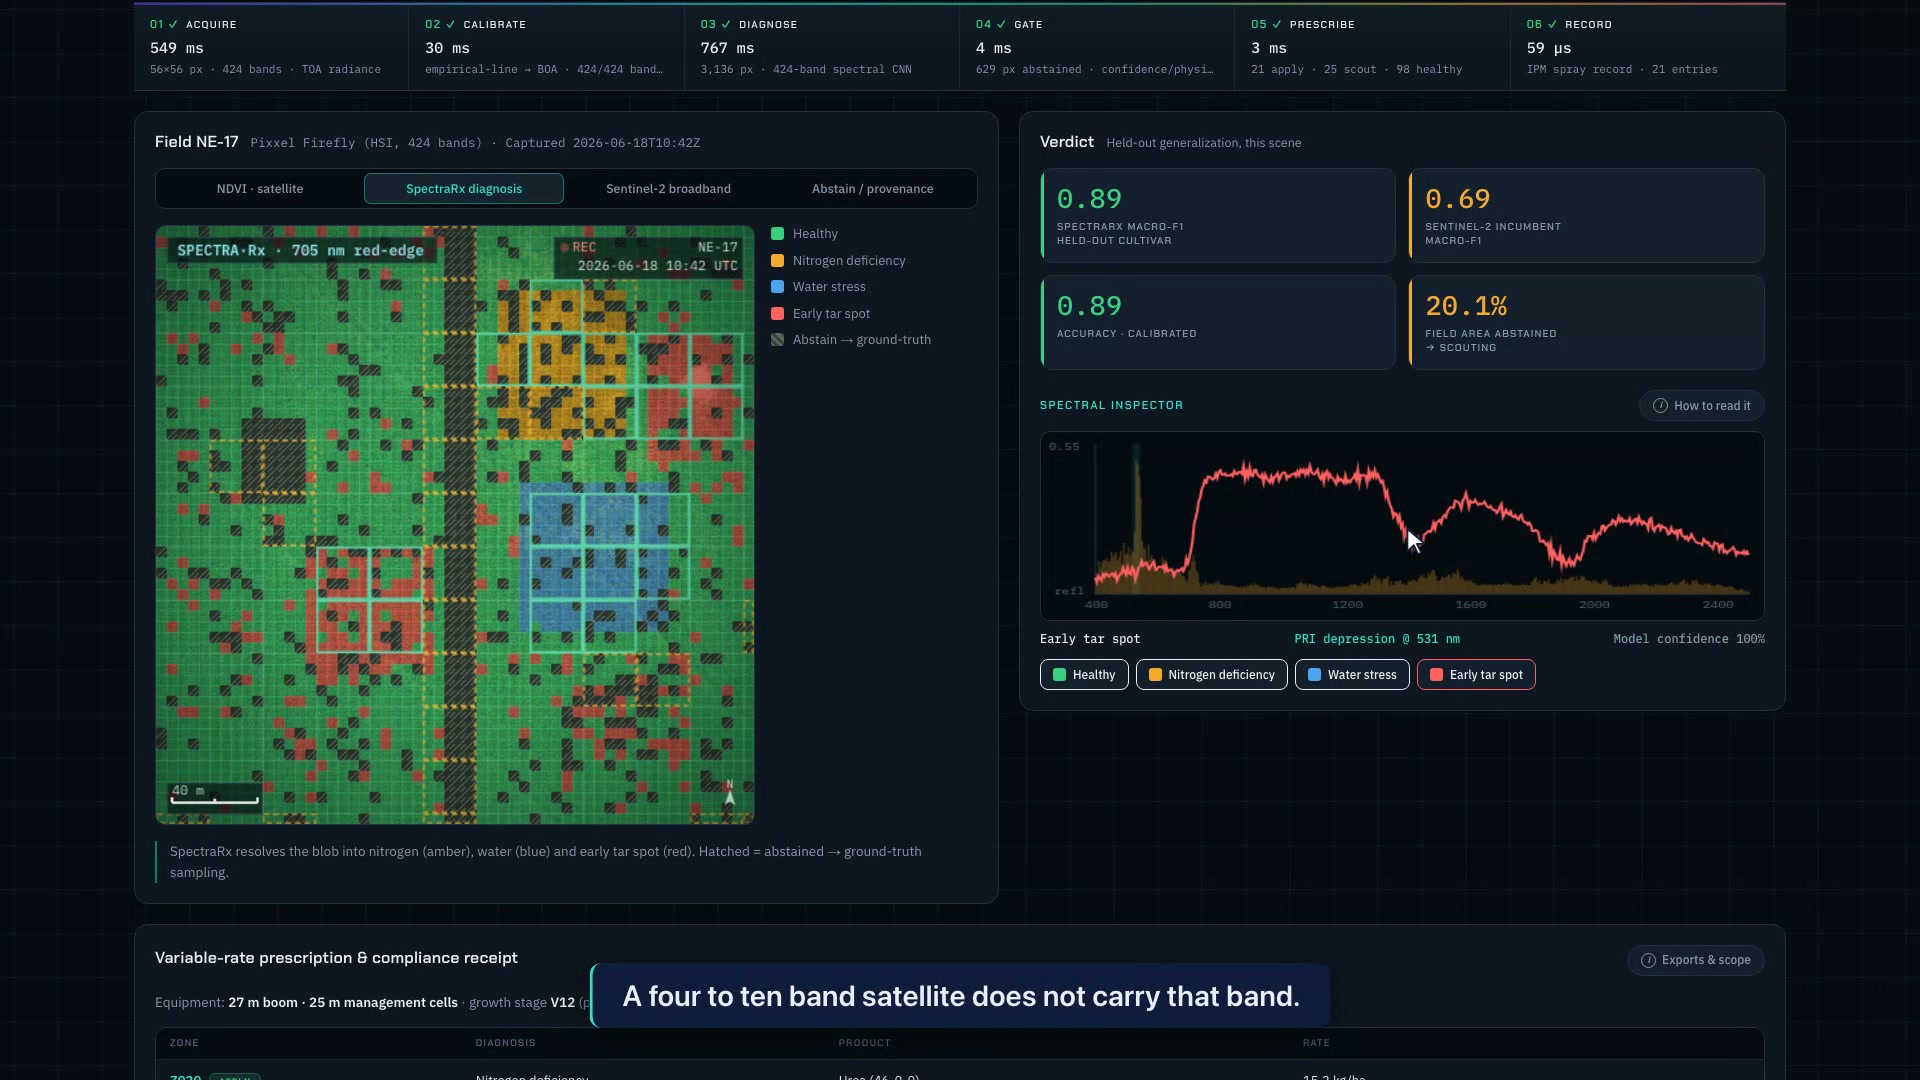
The spectral inspector for an early tar-spot pixel showing a 424-band reflectance curve and an orange band-saliency trace peaking in sampled 530 and 535 nm bins near the PRI diagnostic.
Tar-spot saliency peaks in sampled 530 and 535 nm bins nearest the PRI diagnostic near 531 nm.

Calibration is load-bearing, and the model admits it

Toggling Skip atmospheric correction feeds the classifier raw top-of-atmosphere radiance. Accuracy collapses from 0.887 to 0.373; 92.2 percent of pixels abstain and 140 of 144 management zones route to ground-truth scouting. Four water-stress zones still apply under the zone rule, so this is an inspectable safeguard rather than a universal block.
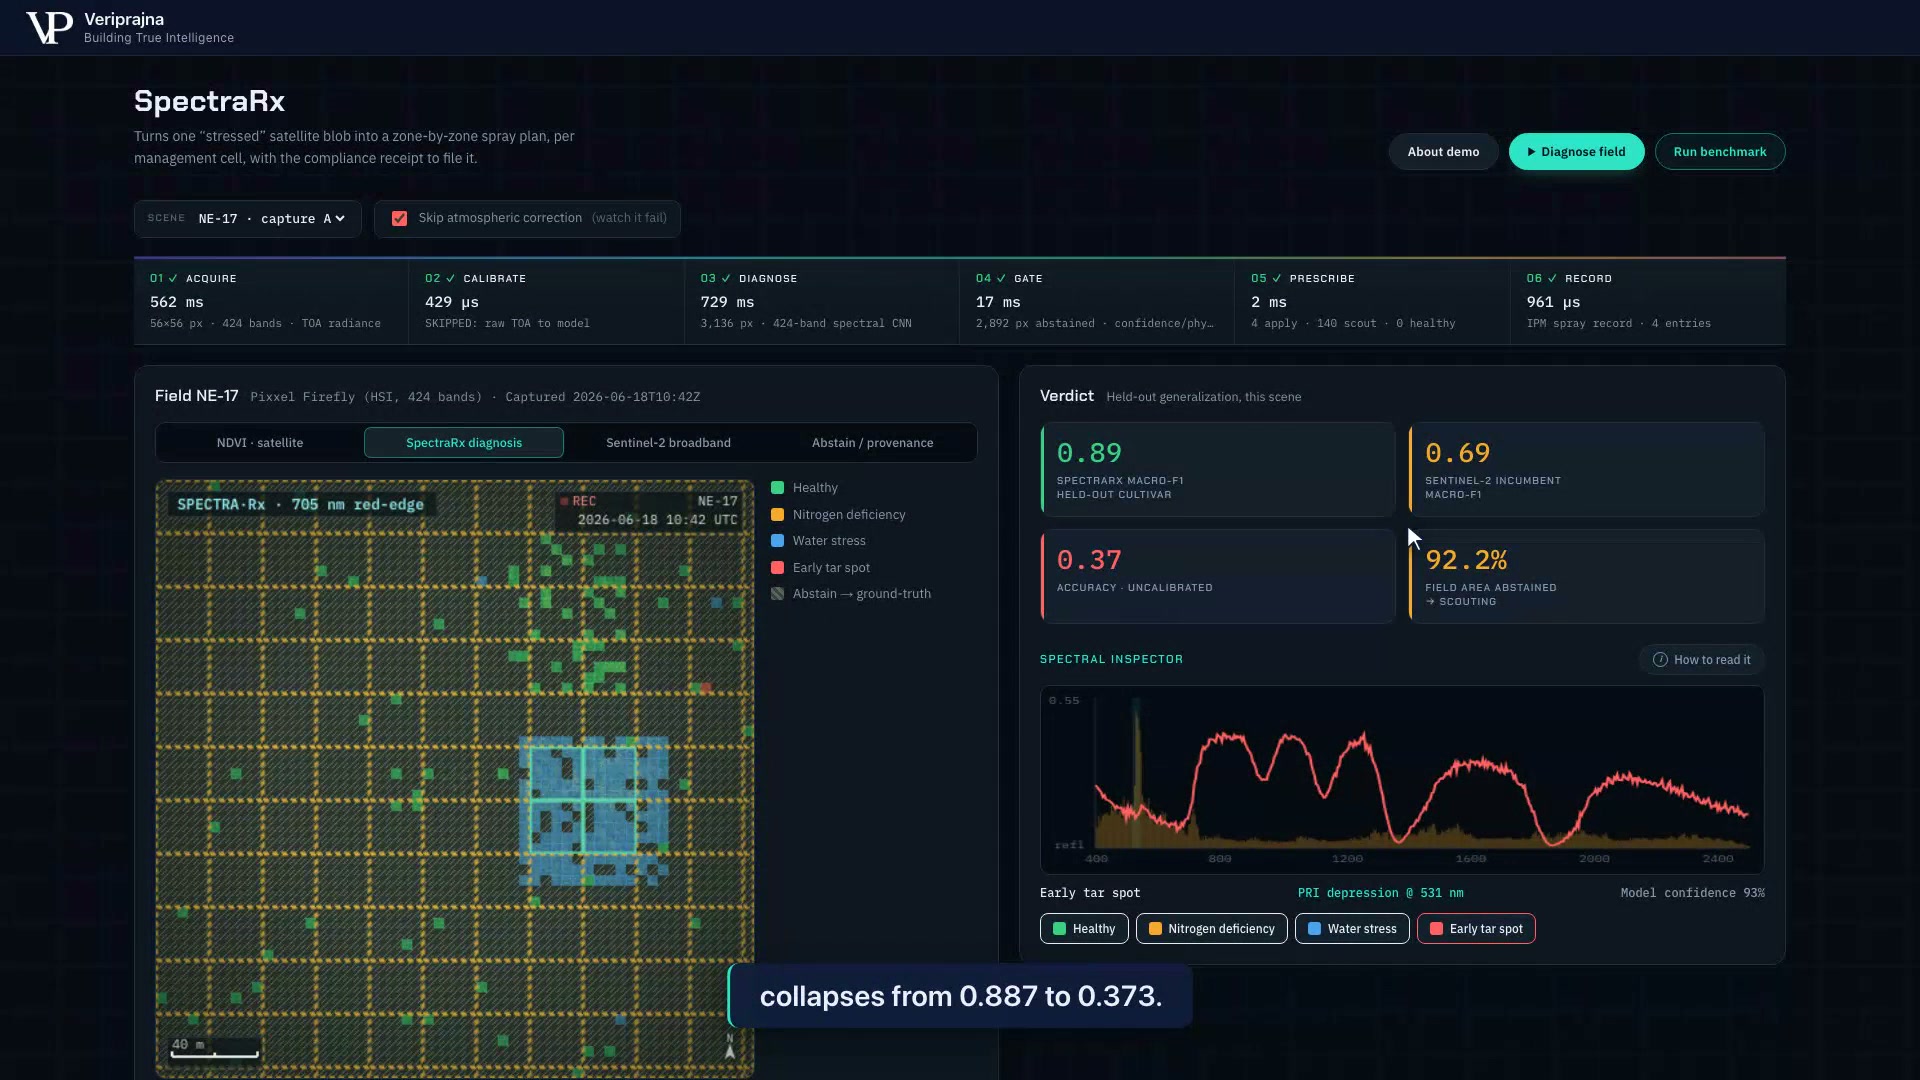
The diagnosis view with Skip atmospheric correction enabled: the accuracy tile reads 0.37 uncalibrated and the field-area-abstained tile reads 92.2 percent, with most of the field hatched and routed to scouting.
Skip the atmospheric correction and accuracy drops to 0.37, with 92.2 percent of the field abstained rather than mis-prescribed.

A prescription a boom can execute, and a record template for review

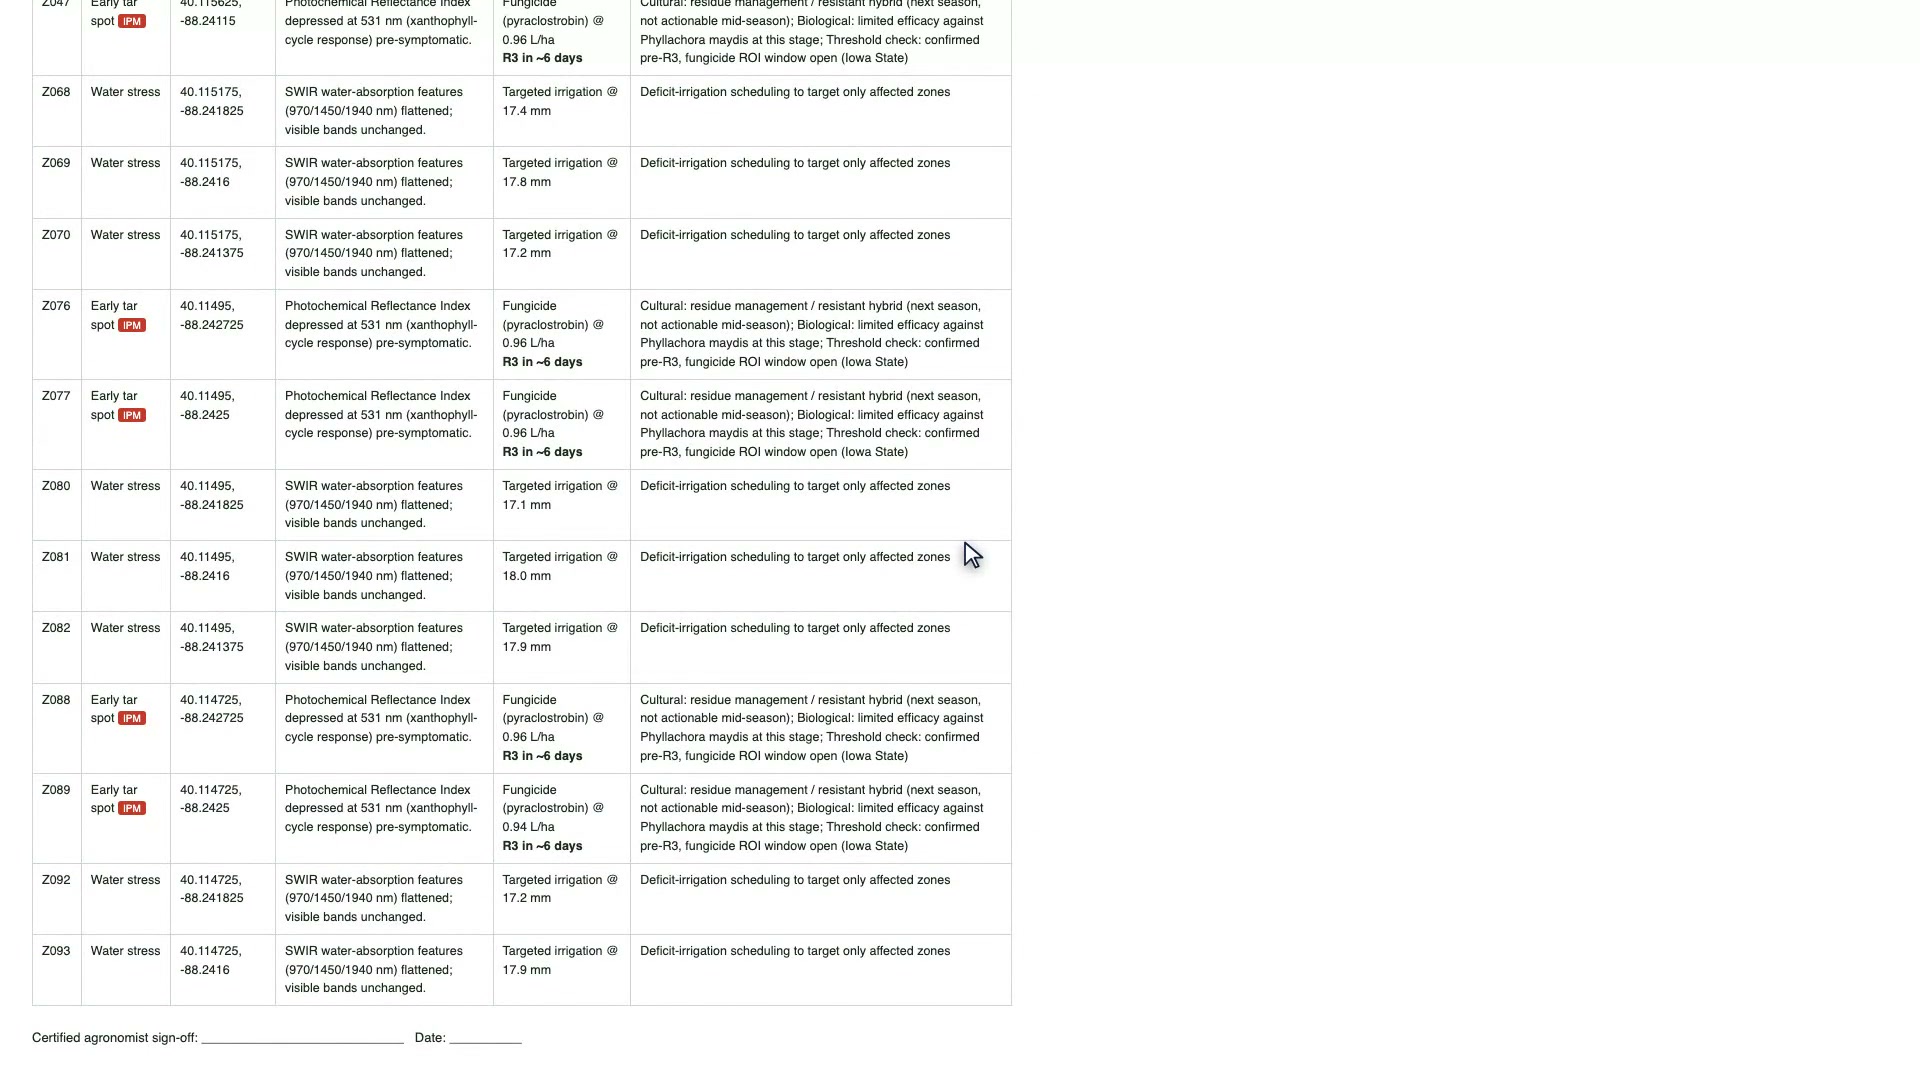
The diagnosis becomes 144 management cells at a 27 m boom profile and 25 m resolution: 21 zones to apply, 25 to scout, and 98 already healthy. Each apply zone carries a product and rate under the demo's deterministic prescription rules. It exports as ISO-XML and GeoJSON, and as the EU Farm-to-Fork IPM-style record, which lists per-zone geo-coordinates, spectral evidence, alternatives evaluated, the R3 deadline, and a certified-agronomist sign-off line.
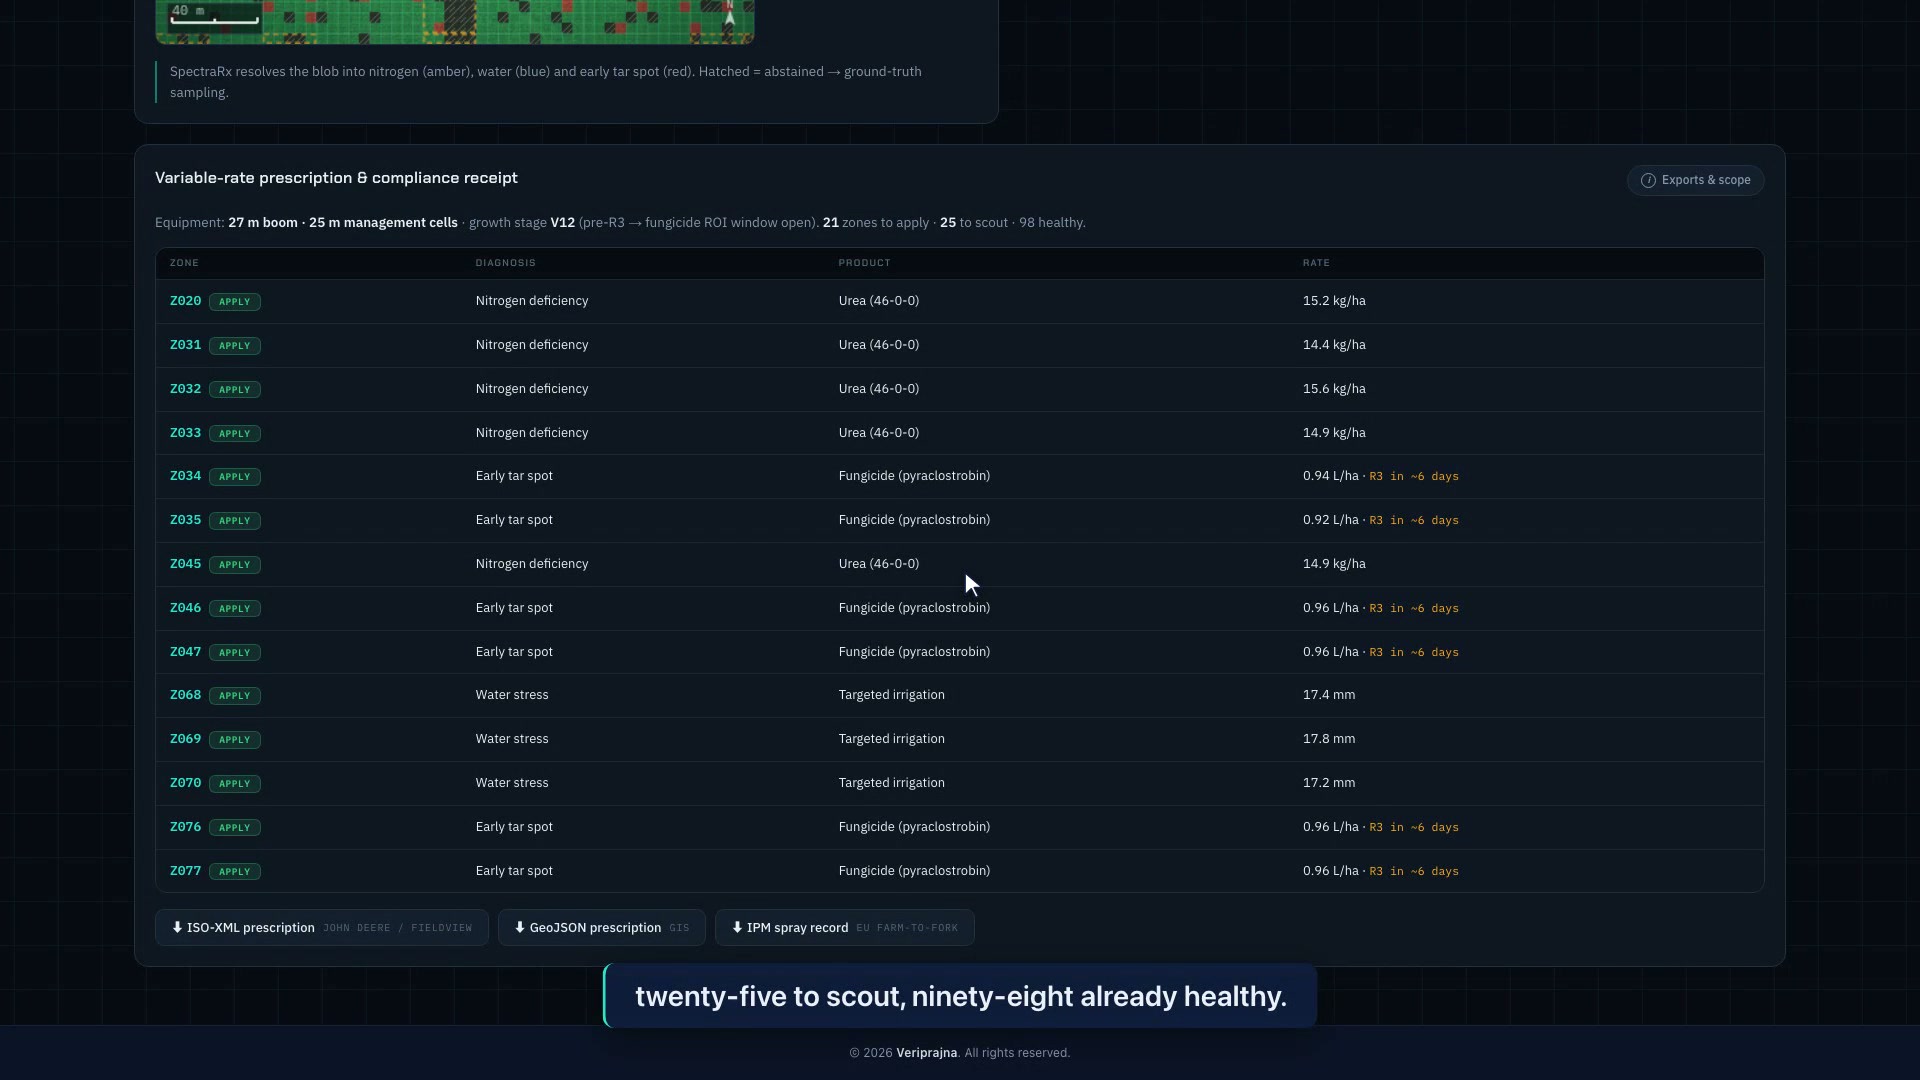
The variable-rate prescription table at 27 m boom and 25 m management cells, growth stage V12, listing per-zone diagnoses, products, and rates, with export buttons for ISO-XML, GeoJSON, and the EU Farm to Fork IPM spray record.
The variable-rate prescription: per-zone products and rates at real boom geometry, exportable to ISO-XML and GeoJSON.
The EU Farm to Fork IPM spray record listing per-zone geo-coordinates, the firing spectral feature such as photochemical reflectance index depressed at 531 nm, product and rate, R3 deadline, alternatives evaluated, and a certified-agronomist sign-off and date line.
The EU Farm to Fork IPM record, with per-zone spectral evidence and a certified-agronomist sign-off line.

Where the broadband incumbent is structurally blind

On the 1,280-pixel held-out, physics-grounded synthetic cultivar-and-soil test, SpectraRx scores macro-F1 0.887 against 0.69 for the Sentinel-2 incumbent and 0.856 for a narrowband physics-feature model. Per class, the incumbent is a genuinely strong baseline on nitrogen, near 1.0. It falls behind on water, 0.63 against 0.97, and on early tar spot, 0.61 against 0.77. This is a mechanism result, not a field guarantee.
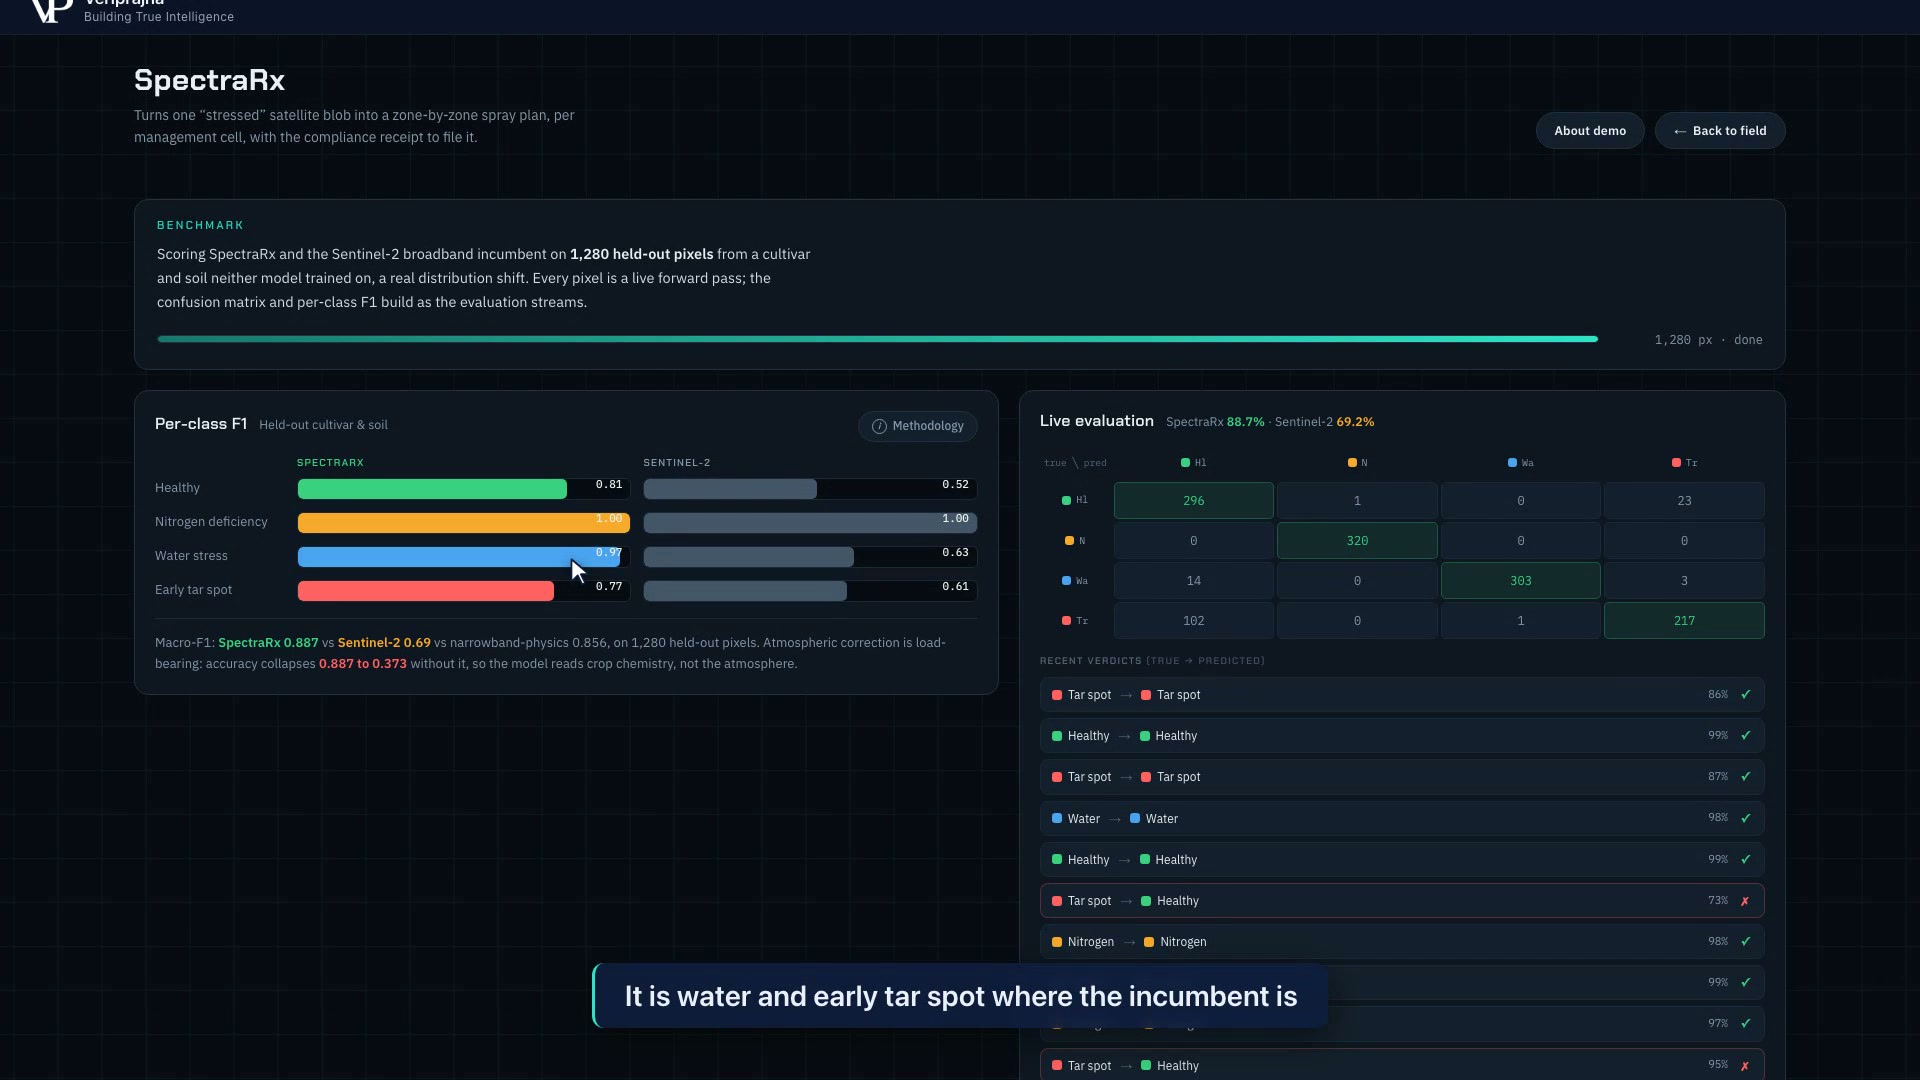
The benchmark screen showing per-class F1 bars for SpectraRx versus Sentinel-2: healthy 0.81 vs 0.52, nitrogen 1.00 vs 1.00, water 0.97 vs 0.63, tar spot 0.77 vs 0.61, plus a confusion matrix and live evaluation of SpectraRx 88.7 percent against Sentinel-2 69.2 percent.
Per-class F1 on the held-out set: the incumbent matches on nitrogen but trails on water and tar spot, where broadband is blind.

Sentinel-2 broadband versus SpectraRx

The same incumbent the demo benchmarks against, side by side. It is a real, strong baseline, not a strawman.

Dimension Sentinel-2 broadband incumbent SpectraRx
Bands read per pixel 13 broadband 424, VNIR and SWIR (400 to 2515 nm)
Separates nitrogen, water, tar spot Nitrogen yes; water and tar spot weakly All three, per pixel
Water stress F1 (held-out set) 0.63 0.97
Early tar spot F1 (held-out set) 0.61 0.77
Behavior on ambiguous or uncalibrated pixels Classifies anyway Abstains, routes to ground-truth scouting
What you get out A stress flag A typed diagnosis, a variable-rate prescription, and a reviewable IPM-style record template

What this demo does not do

  • ✓ It does not use real field captures. The scenes are physics-grounded synthetic hyperspectral cubes; the healthy baseline follows published green-vegetation reflectance and the stress signatures are documented physical perturbations. Real-world accuracy needs a two-season ground-truth library, which is deferred.
  • ✓ It does not present 0.887 macro-F1 as an open-world guarantee. That is a result on a 1,280-pixel held-out synthetic distribution-shift set, for a single crop (corn) and a single geography.
  • ✓ It does not connect to live sensors or farm-management platforms. Live sensor integrations and partner push connectors are not implemented. The ISO-XML and GeoJSON export formats are real.
  • ✓ It does not let a language model make the call. The deterministic gate decides; the optional LLM only renders IPM prose from computed facts, defaults to a templated fallback, and is out of the trust path.
  • ✓ It does not carry customers, deployments, pilots, endorsements, or ROI figures. None exist yet. This is a demo that proves the mechanism.

Questions buyers actually ask

How is this different from the NDVI and satellite monitoring we already pay for?

NDVI and multispectral monitoring can detect that something is wrong without identifying the cause. SpectraRx reads the full 424-band reflectance curve at each pixel and names the diagnosis, the firing wavelengths, and the action path. On the demo's 1,280-pixel held-out, physics-grounded synthetic cultivar-and-soil test, it separates stress types at macro-F1 0.887 against 0.69 for the Sentinel-2 broadband incumbent; water stress is 0.97 versus 0.63 and early tar spot is 0.77 versus 0.61.

How do I know the model is reading crop stress and not just memorizing your data?

Hover any zone in the spectral inspector and it draws a band-saliency trace showing which wavelengths the CNN actually weighted, computed independently of the classifier's own features. Tar spot is associated with the 531 nm photochemical reflectance index band and nitrogen with the 680 to 720 nm red-edge. The system also checks documented 970, 1450, and 1940 nm SWIR water diagnostics, without representing them as the CNN's top saliency peaks. The benchmark is a held-out synthetic set from a cultivar and soil neither model trained on.

What happens on pixels the model isn't sure about?

Three deterministic gates sit outside the model: a calibration-provenance gate, a confidence and ambiguity gate, and a physics-agreement check that abstains if the CNN's class disagrees with the documented physical feature. Zones at or above 34 percent abstained pixels route to scouting; other zones are prescribed from their non-abstained majority. On the default calibrated scene, 20.1 percent of pixels abstain. This is a visible safeguard, not a perfection claim; tar-spot F1 is 0.77.

Can it actually drive our variable-rate equipment, or is it just a map?

The diagnosis map is aggregated from 5 m pixels to 25 m management cells using a 27 m boom profile. In the demo that produces 144 management cells (21 to apply, 25 to scout, 98 healthy), with per-zone products and rates, and it exports as ISO-XML and GeoJSON. The export formats are real; live partner push connectors are not implemented in this demo.

Does this produce the records we need for EU Farm to Fork and IPM compliance?

SpectraRx generates an EU Farm-to-Fork IPM-style record template deterministically from the diagnosis and prescription: geo-coordinates, per-zone spectral evidence and majority-class zone coverage, alternatives evaluated, the recommended product and rate, the fungicide-window deadline, calibration provenance, model name and version, and a certified-agronomist sign-off line. The demo does not claim a live regulatory filing or connector.

The scenes are synthetic. Why should I trust the numbers?

Every number reproduces exactly under fixed seeds and is measured on a held-out set of 1,280 pixels from a cultivar and soil neither model trained on, a distribution shift rather than memorization. The scenes are physics-grounded synthetic cubes: the healthy baseline follows published green-vegetation reflectance and the stress signatures are documented physical perturbations injected independently of the classifier. We state the 0.887 macro-F1 as a result on that labeled synthetic set for a single crop and geography, never as an open-world field guarantee. Real-world accuracy needs a two-season ground-truth library, which is deferred work.

Do you connect to our sensors and John Deere Operations Center today?

Not in this demo. Live sensor integrations and partner push connectors are not implemented. What is real is the analytics chain: atmospheric correction, the 424-band spectral CNN, deterministic gates, prescription math, and ISO-XML, GeoJSON, and IPM-style export formats. Veriprajna builds sensor-agnostic analytics; we do not own satellites or manufacture sensors.

Technical Research

The research behind this demo — the architecture, the verification design, and the enterprise blueprint.

Closing the gap between a stress flag and a spray plan?

The hard part is the calibrated, abstaining, equipment-aware chain, not the classifier. We build it.

If your team is sitting on stress maps you cannot act on, the interesting problem is where to draw the abstain line for your crop, sensors, and equipment. That is the conversation we would rather have than a pitch.

Spectral analytics assessment

  • ✓ Map where a stress flag stalls your agronomy decisions
  • ✓ Define the diagnostic wavelengths and classes for your crops
  • ✓ Set the calibration-provenance and abstain thresholds
  • ✓ Specify the IPM record your compliance team must file

Build the chain

  • ✓ A spectral classifier over your sensors and cultivars
  • ✓ Atmospheric correction with per-scene provenance
  • ✓ Equipment-aware variable-rate prescriptions (ISO-XML, GeoJSON)
  • ✓ EU Farm to Fork IPM-style record templates for review