The satellite called my corn block "stressed" and quit there
I built the opening scene around an NDVI stress alert because it cannot tell an agronomist whether a corn block needs nitrogen, water, or an early-tar-spot scout. A label without a cause cannot support a spray decision.
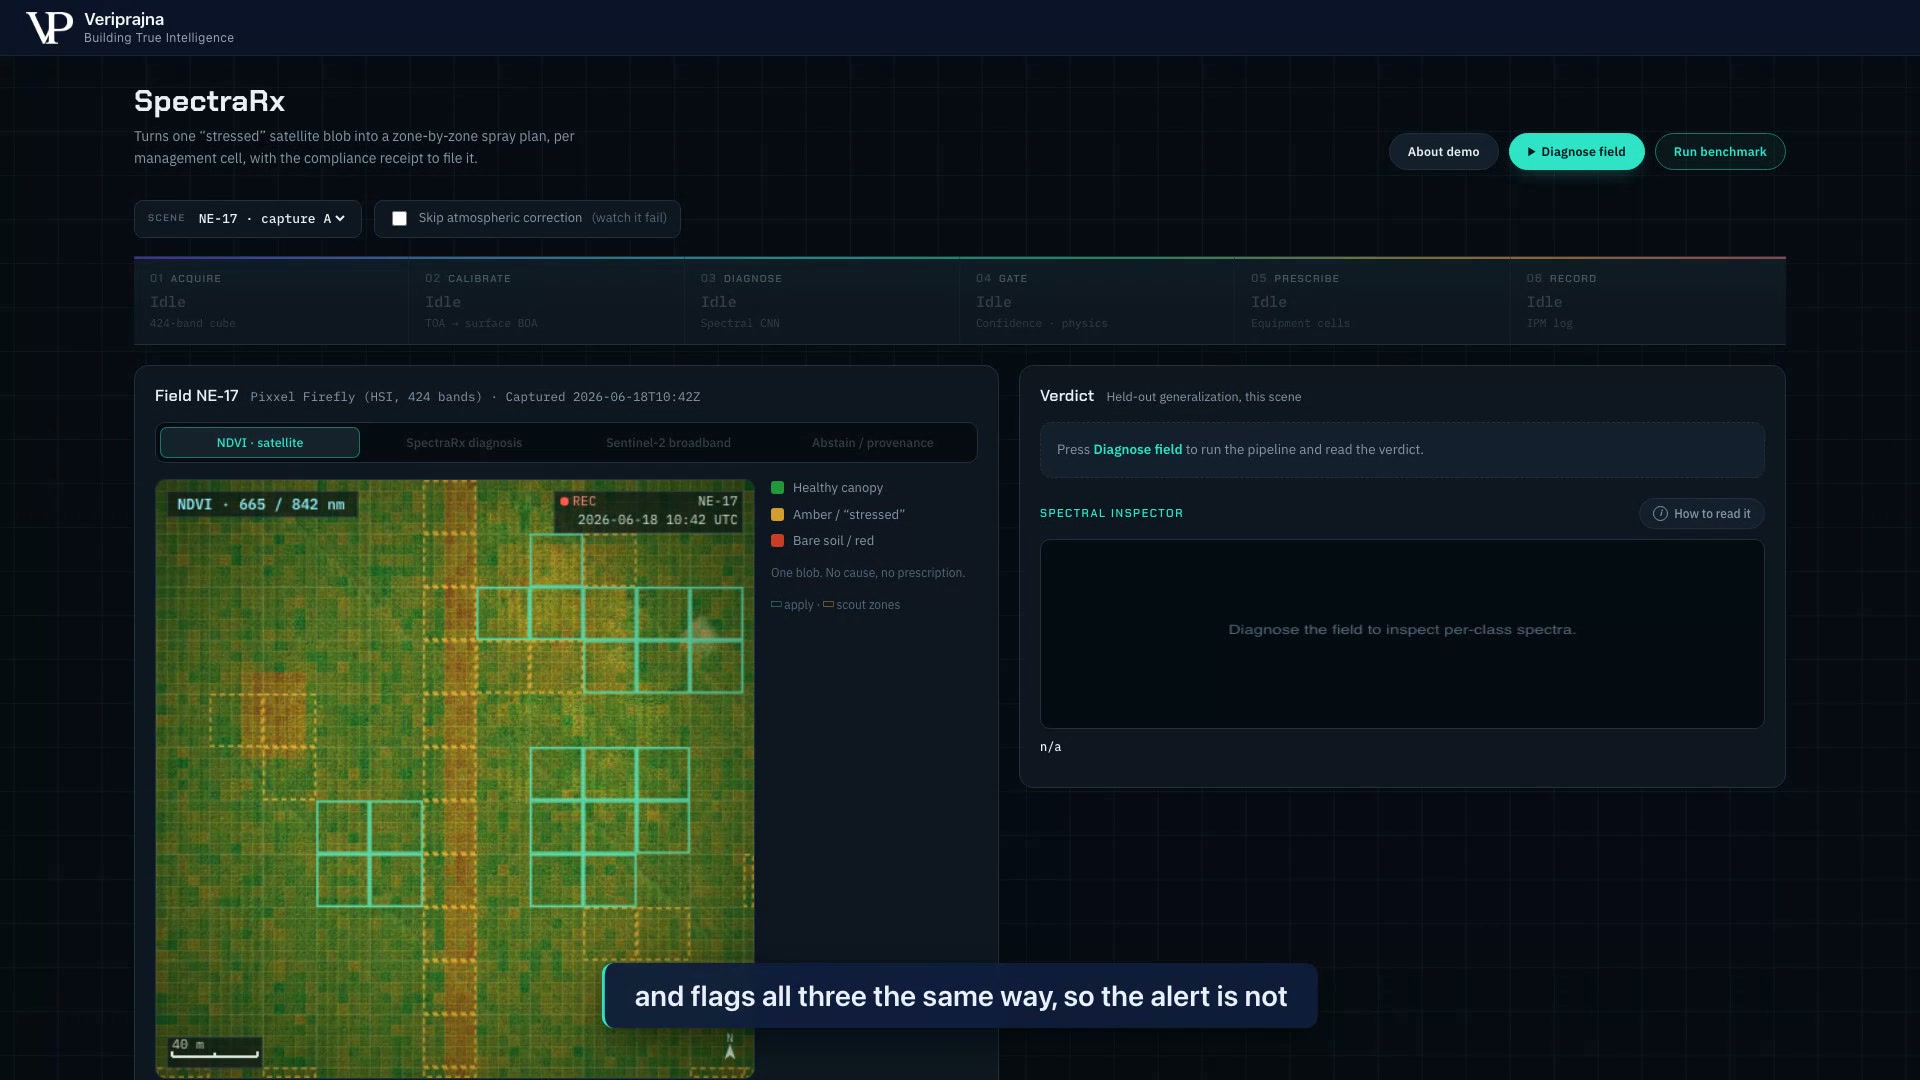 The satellite view the demo opens on: one amber region labelled "stressed," with no cause or prescription attached.
So I built SpectraRx to start where that map stops. It reads the full 424-band hyperspectral curve at every pixel, from 400 to 2515 nanometers across the visible, near-infrared and shortwave-infrared, and classifies each pixel's whole spectral signature instead of a broadband average. When I click Diagnose, the single amber region in the northeast quarter splits into typed zones: nitrogen in amber, water stress in blue, early tar spot in red, with hatched cells marked as abstained and routed to ground-truth scouting rather than guessed at. The scenes are synthetic, physics-grounded cubes, not real captures. I injected documented stress signatures on top of a published green-vegetation reflectance baseline, on purpose, so I could show the mechanism without pretending I had two seasons of field ground truth I do not yet have.
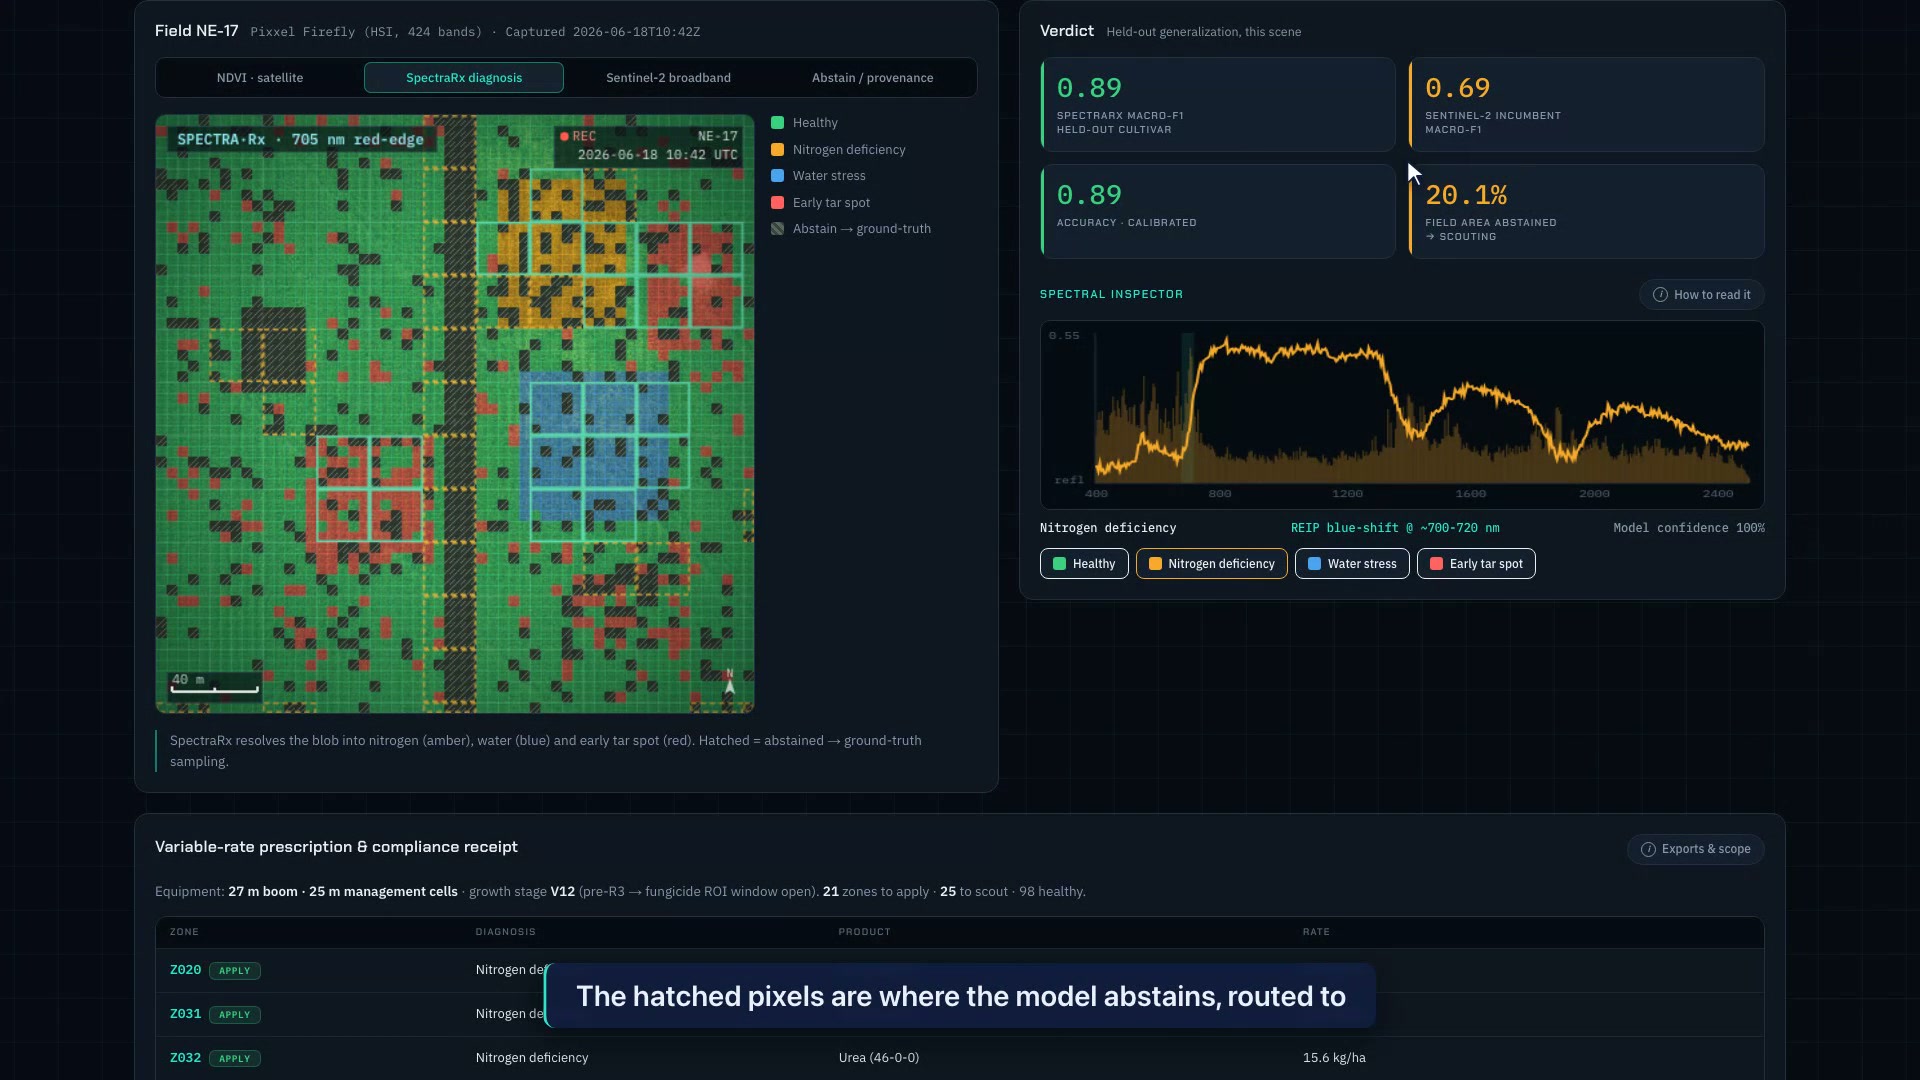 After Diagnose, the single amber region splits into typed zones: nitrogen (amber), water (blue), early tar spot (red), and hatched abstained pixels. The held-out synthetic benchmark is 0.887 macro-F1 for SpectraRx against 0.69 for the Sentinel-2 incumbent. In this default calibrated demo scene, 20.1 percent of pixels abstain.
Why I didn't trust my own 0.887
I did not believe the first strong score my classifier produced, and that distrust is the most useful thing I brought to this build. The custom 1-D spectral CNN, written from scratch in numpy, scored 0.887 macro-F1 on a held-out, physics-grounded synthetic test of 1,280 pixels from a cultivar and soil the model never trained on, a synthetic distribution shift rather than memorized data. On synthetic scenes a good number is exactly what should make you nervous. A network can learn the labels you injected instead of the physics you meant to teach it, and the score reads identical either way.
So I made the model show its work. The spectral inspector plots band-saliency: the wavelengths the CNN actually weighted to reach its call, computed independently of the hand-engineered physics features. For tar spot, the sampled peak sits in the 530 and 535 nanometer bins nearest the photochemical reflectance index diagnostic near 531 nanometers. On nitrogen it sits on the 680 to 720 nanometer red-edge. For water, the system checks documented shortwave-infrared diagnostic features; I do not treat those checks as a claim about the CNN's highest saliency peak.
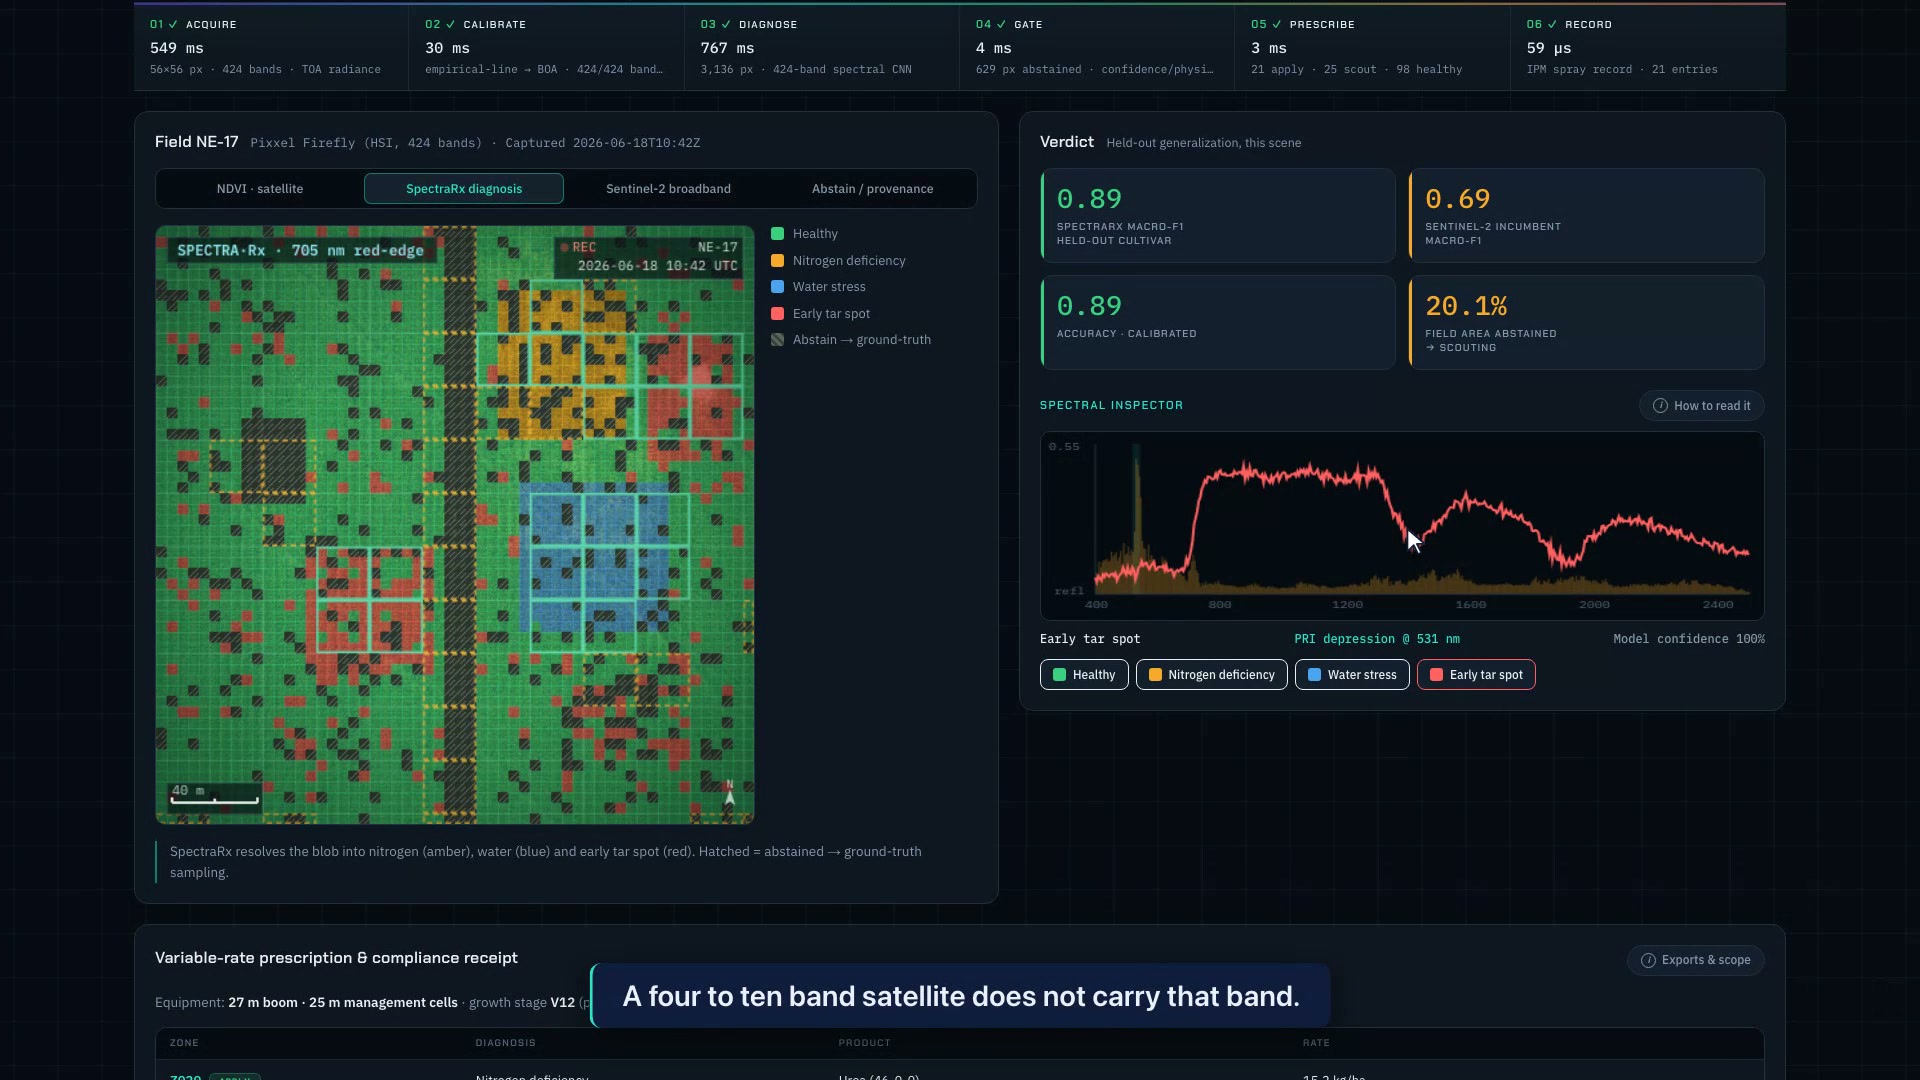 Band-saliency for a tar-spot pixel. The orange trace peaks in sampled 530 and 535 nanometer bins nearest the PRI diagnostic near 531 nanometers.
The per-class numbers are the ones I point skeptics to, because they show where the broadband incumbent loses. On that held-out, physics-grounded synthetic test, SpectraRx scores 0.77 on early tar spot against the Sentinel-2 incumbent's 0.61, and 0.97 on water stress against 0.63. On nitrogen both models score near 1.0, and I left that baseline strong on purpose rather than build a strawman that loses everywhere.
The toggle that taught me the classifier was the least of it
I put a checkbox in the demo labeled "Skip atmospheric correction," and clicking it is what reorganized how I think about the whole system. On the held-out, physics-grounded synthetic test, correction on records 0.887 accuracy. Tick the box, feed the model raw top-of-atmosphere radiance instead of corrected surface reflectance, and accuracy collapses to 0.373. In the seed-7 demo scene the downstream gates then send most pixels to abstention, rather than treating the diagnosis as a field guarantee.
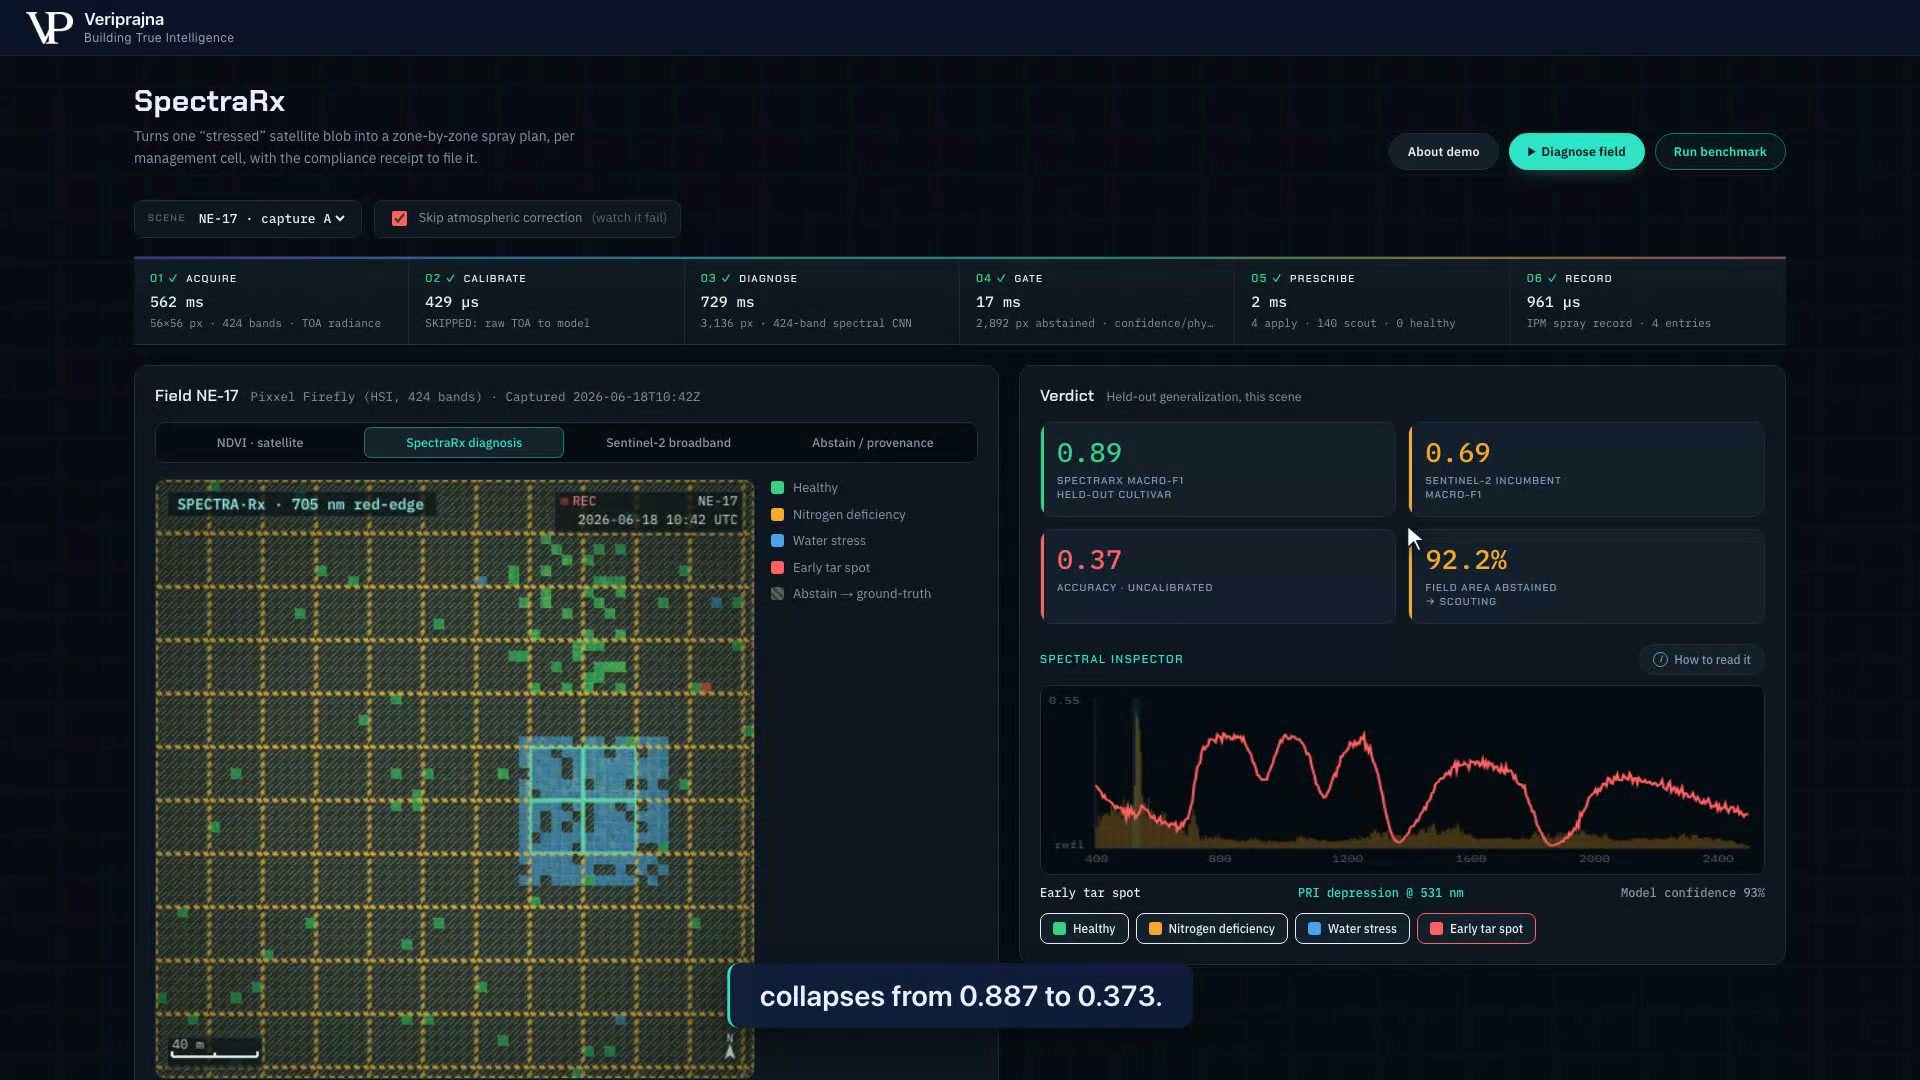 The same trained model on raw top-of-atmosphere radiance. On the held-out synthetic test, accuracy falls from 0.887 to 0.373. In the seed-7 demo scene, 92.2 percent of pixels abstain, 140 of 144 zones route to scouting, and four water-stress zones still apply.
What I find more telling than the collapse is what the system does with it. In the skipped-calibration seed-7 demo scene, 92.2 percent of pixels abstain and 140 of 144 management zones route to ground-truth scouting. Four water-stress zones still apply under the zone rule, so this is an inspectable safeguard rather than a universal refusal. In the default calibrated demo scene, 20.1 percent of pixels abstain. The useful behavior is the explicit scout path when evidence is weak, rather than pretending the system has no uncertainty.
This is what I keep coming back to. Everyone in agricultural AI is racing to a better crop-stress classifier, and even a perfect one leaves the buyer needing calibrated reflectance with provenance, a defensible scout path, a prescription an actual machine can execute, and a record template for compliance review. The durable engineering is that chain and that discipline, not the model's error rate.
What a 27-meter boom can actually spray
The prescription is where I had to stop thinking like a modeler and start thinking like the machine in the field. SpectraRx aggregates 5-meter diagnosis pixels into 25-meter management cells using a 27-meter boom profile. The default scene has 144 cells: 21 apply zones, 25 scout zones, and 98 healthy zones, at growth stage V12. The deterministic rule permits fungicide only inside the configured R3 window. It exports as ISO-XML and GeoJSON.
Then the receipt, which I built for the compliance officer who sits next to the agronomist. SpectraRx deterministically generates an EU Farm-to-Fork IPM-style record template from the diagnosis and prescription: per-zone spectral evidence and majority-class zone coverage, alternatives considered, the product and rate, the R3 deadline, calibration provenance, and a sign-off line. A compliance officer can review the template without reverse-engineering what the model did.
The choice I am most sure about
The decision I defend hardest on this build is one I chose not to make: I kept the language model out of the trust path. You do not classify a 424-band cube with an LLM, and putting one anywhere in the diagnosis or the gate would lower my credibility with a remote-sensing engineer while adding no correctness. The only place a model writes anything is optional IPM justification prose from facts already computed, with a templated fallback so the demo runs with no API key at all. That was the more senior call, not a gap I am apologizing for.
Here is the scope I hold this to. The 0.887 result is on 1,280 held-out synthetic pixels for a single crop in a single geography, not a field guarantee, and real-world accuracy still needs the two-season ground-truth library I have not built. Live sensor and farm-management integrations are not implemented; the export formats are real. I keep returning to the same standard: a prescription should make its calibration, abstention, and equipment assumptions easy for a reviewer to inspect.