A satellite can flag a corn block as stressed. It cannot distinguish nitrogen, water, or early tar spot, and each diagnosis leads to a different response. The hard part is converting that stress alert into a prescription an agronomist can inspect and an operator can execute.
We built SpectraRx, a hyperspectral diagnosis-to-prescription engine, to test exactly that. Its scenes and benchmark are physics-grounded synthetic evidence for one crop and geography, not field guarantees. It reads the full 424-band reflectance curve (400 to 2515 nm, VNIR and SWIR) at every pixel, names what is wrong and why, and turns the diagnosis into an equipment-ready spray plan plus an IPM-style record template. You can run it at https://veriprajna.com/demos/hyperspectral-agriculture-ai. What building it taught us is that the accuracy of the classifier is the least durable thing in the whole system.
The classifier is the commodity
Assume the perfect crop-stress model exists tomorrow. It still hands you four problems it cannot solve on its own. It needs surface reflectance with calibration provenance, because the deliberate raw top-of-atmosphere path changes the classifier input and the downstream gates expose the uncertainty. It needs a way to abstain on pixels it cannot defend, instead of prescribing over a mixed or low-confidence signal. It needs a prescription snapped to real equipment geometry, because 5 m diagnosis pixels still need aggregation for a 27 m boom. And it needs a reviewable record template. None of those four is a model-quality problem, and none of them get better when the next model ships.
A system worth operating makes its calibration, refusals, and prescription geometry inspectable instead of leaving the buyer with a score and no basis for a spray decision.
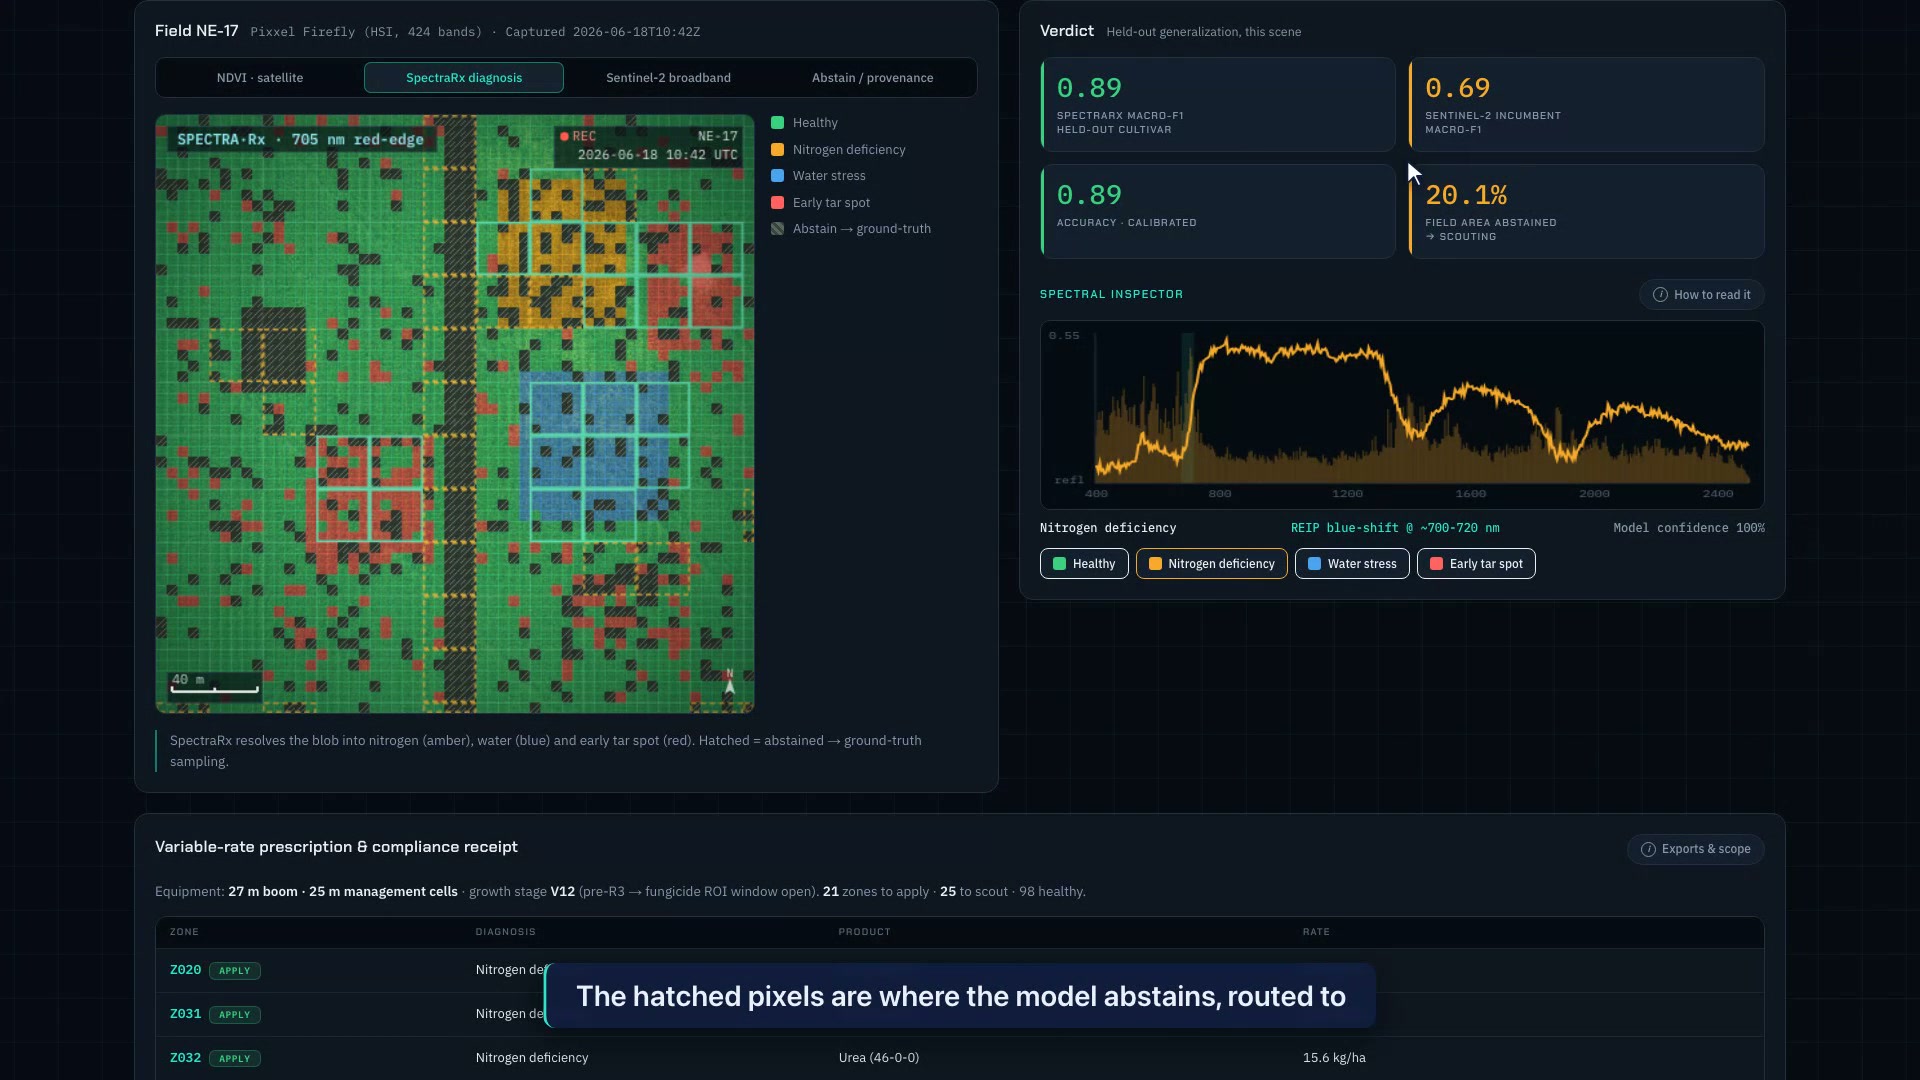 The running synthetic demo resolves one amber NDVI blob into typed zones: nitrogen (amber), water (blue), early tar spot (red), and hatched abstained pixels. The held-out synthetic benchmark is 0.887 macro-F1 against the Sentinel-2 incumbent's 0.69. In this default calibrated demo scene, 20.1 percent of pixels abstain.
The demo makes the first step concrete. One amber "stressed" blob on the NDVI tab splits, on Diagnose, into typed zones, and the pixels the model cannot defend are hatched out and sent to scouting rather than sprayed.
The catch you can watch
The most convincing thing in the demo is a checkbox that breaks it on purpose. On the held-out, physics-grounded synthetic test, toggle "Skip atmospheric correction," feed the same spectral CNN raw TOA radiance instead of calibrated bottom-of-atmosphere reflectance, and accuracy falls from 0.887 to 0.373. That is not a subtle degradation. The model is now wrong more often than right.
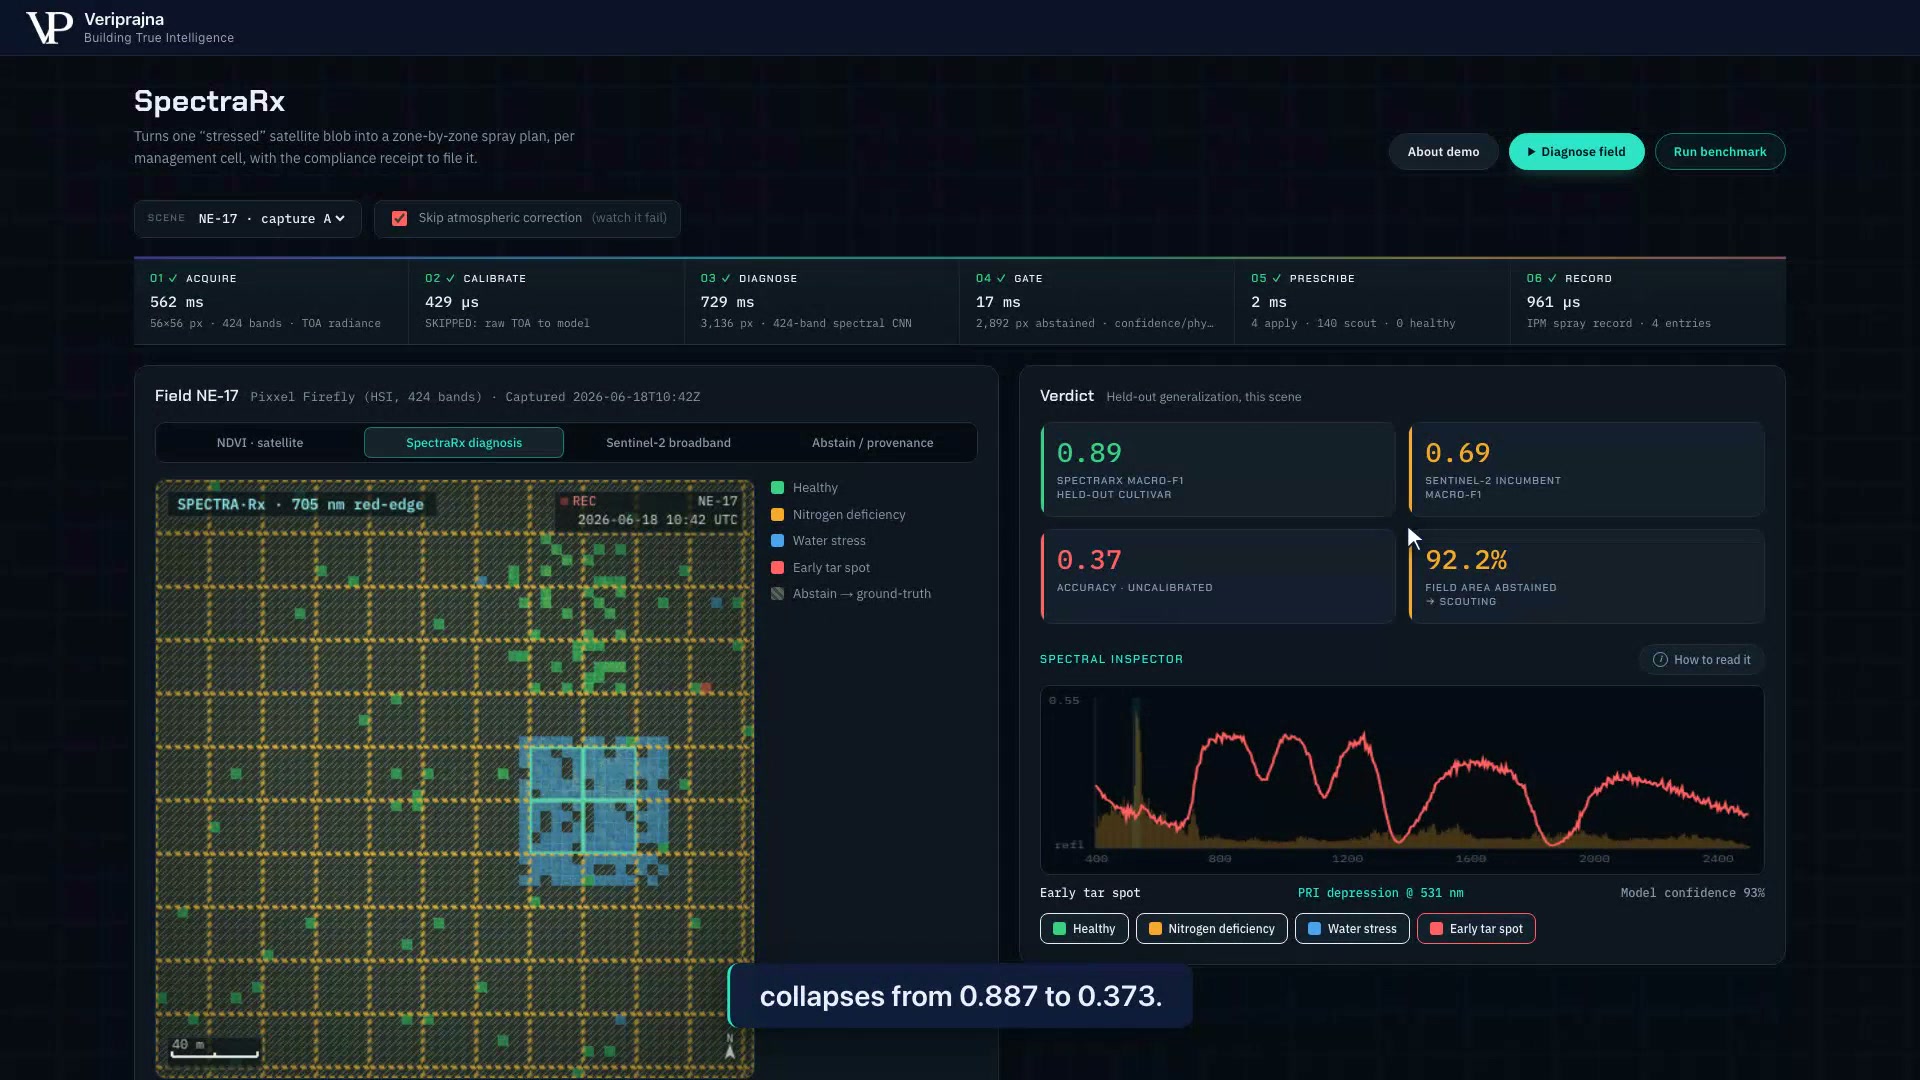 The same seed-7 synthetic demo scene with "Skip atmospheric correction" toggled on. On the held-out synthetic test, accuracy drops from 0.887 to 0.373. In this demo scene, 92.2 percent of pixels abstain, 140 of 144 management zones route to scouting, and four water-stress zones still apply.
Then look at what the system does with being wrong. Raw TOA reaches the classifier in this deliberate test. The downstream confidence and physics-agreement gates drive most of the abstention: 92.2 percent of pixels abstain and 140 of 144 management zones route to ground-truth sampling. Four water-stress zones still apply under the zone rule, which is why the behavior is inspectable rather than described as a universal refusal.
Calibration provenance, an abstain-with-evidence discipline, equipment-aware prescription, and a reviewable IPM-style record template are stable properties of the system. They do not age out when a better crop-stress model ships.
Why the gap is physics, not an error rate
There is a second reason we are comfortable calling the moat durable. On the demo's 1,280-pixel held-out, physics-grounded synthetic unseen-cultivar-and-soil test, SpectraRx scores 0.887 macro-F1 to 0.69 against the Sentinel-2 broadband incumbent. The baseline scores near 1.0 on nitrogen, the same category where SpectraRx does, so it is not a strawman.
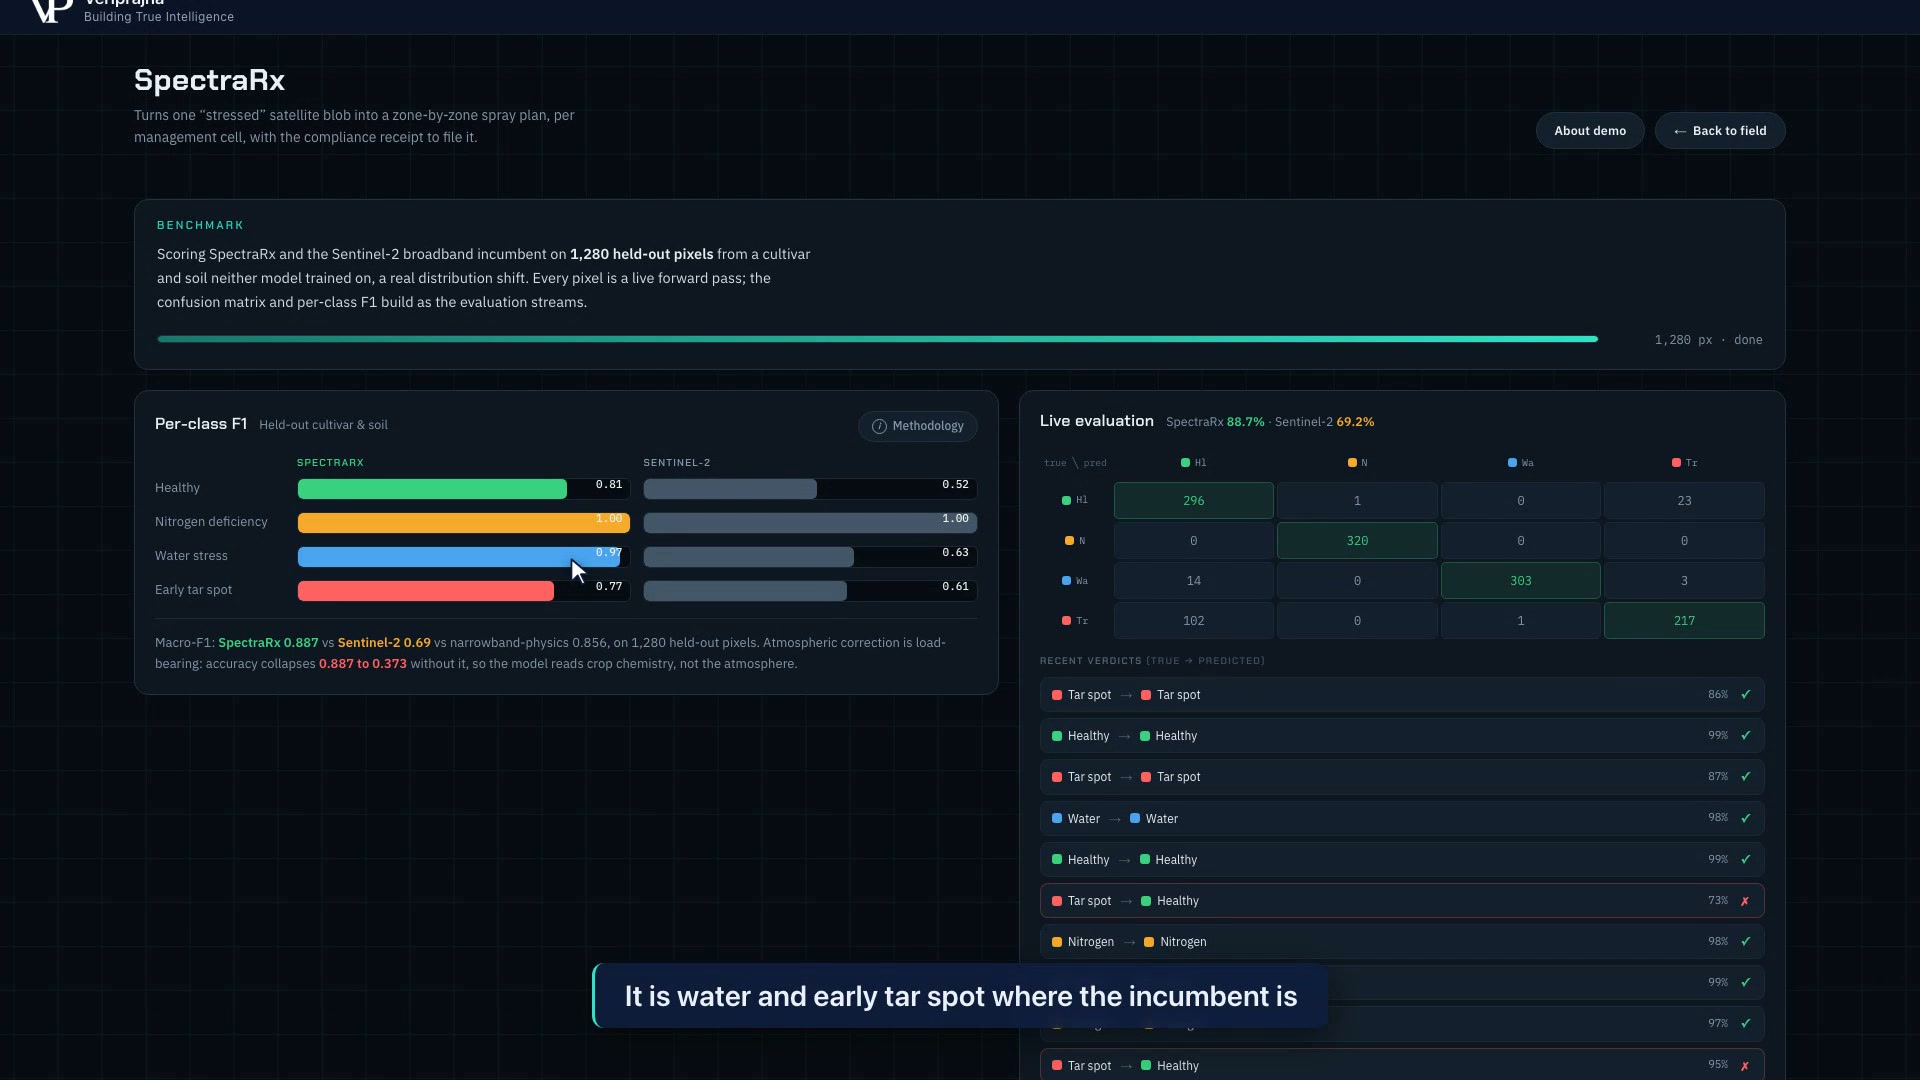 Per-class F1 on the 1,280-pixel held-out synthetic unseen-cultivar-and-soil set. SpectraRx against the Sentinel-2 broadband incumbent: nitrogen ties near 1.00, water stress is 0.97 against 0.63, and early tar spot is 0.77 against 0.61. Macro-F1 is 0.887 against 0.69.
On that held-out, physics-grounded synthetic test, the separation is concentrated in water stress and early tar spot: 0.97 against 0.63 for water, and 0.77 against 0.61 for early tar spot. The spectral inspector makes the diagnosis inspectable by showing the firing wavelength rather than asking the operator to accept a class label on trust.
We built one more check against our own bias. A separate band-saliency trace shows which wavelengths the CNN actually weighted, computed independently of its features. It peaks for tar spot in the sampled 530 and 535 nm bins nearest the PRI diagnostic near 531 nm, and shows nitrogen evidence in the 680 to 720 nm red edge. Water SWIR bands are diagnostic checks, not asserted top saliency peaks.
What ships, and what files
The end of the chain is where the durable value concentrates. The diagnosis becomes management zones aggregated from 5 m pixels to 25 m cells using a 27 m boom profile, then exports as ISO-XML and GeoJSON. Fungicide is prescribed only inside the configured R3 window. Zones at or above 34 percent abstained pixels route to scouting; other zones use their non-abstained majority. The export formats are real; live partner push connectors are not implemented in the demo.
Then it creates an EU Farm-to-Fork IPM-style record template from the diagnosis and prescription: per-zone geo-coordinates, spectral evidence and majority-class zone coverage, alternatives considered, the product and rate, the R3 deadline, calibration provenance, and the agronomist sign-off line. It is a demo-generated template for agronomist and compliance review, not a live filing.
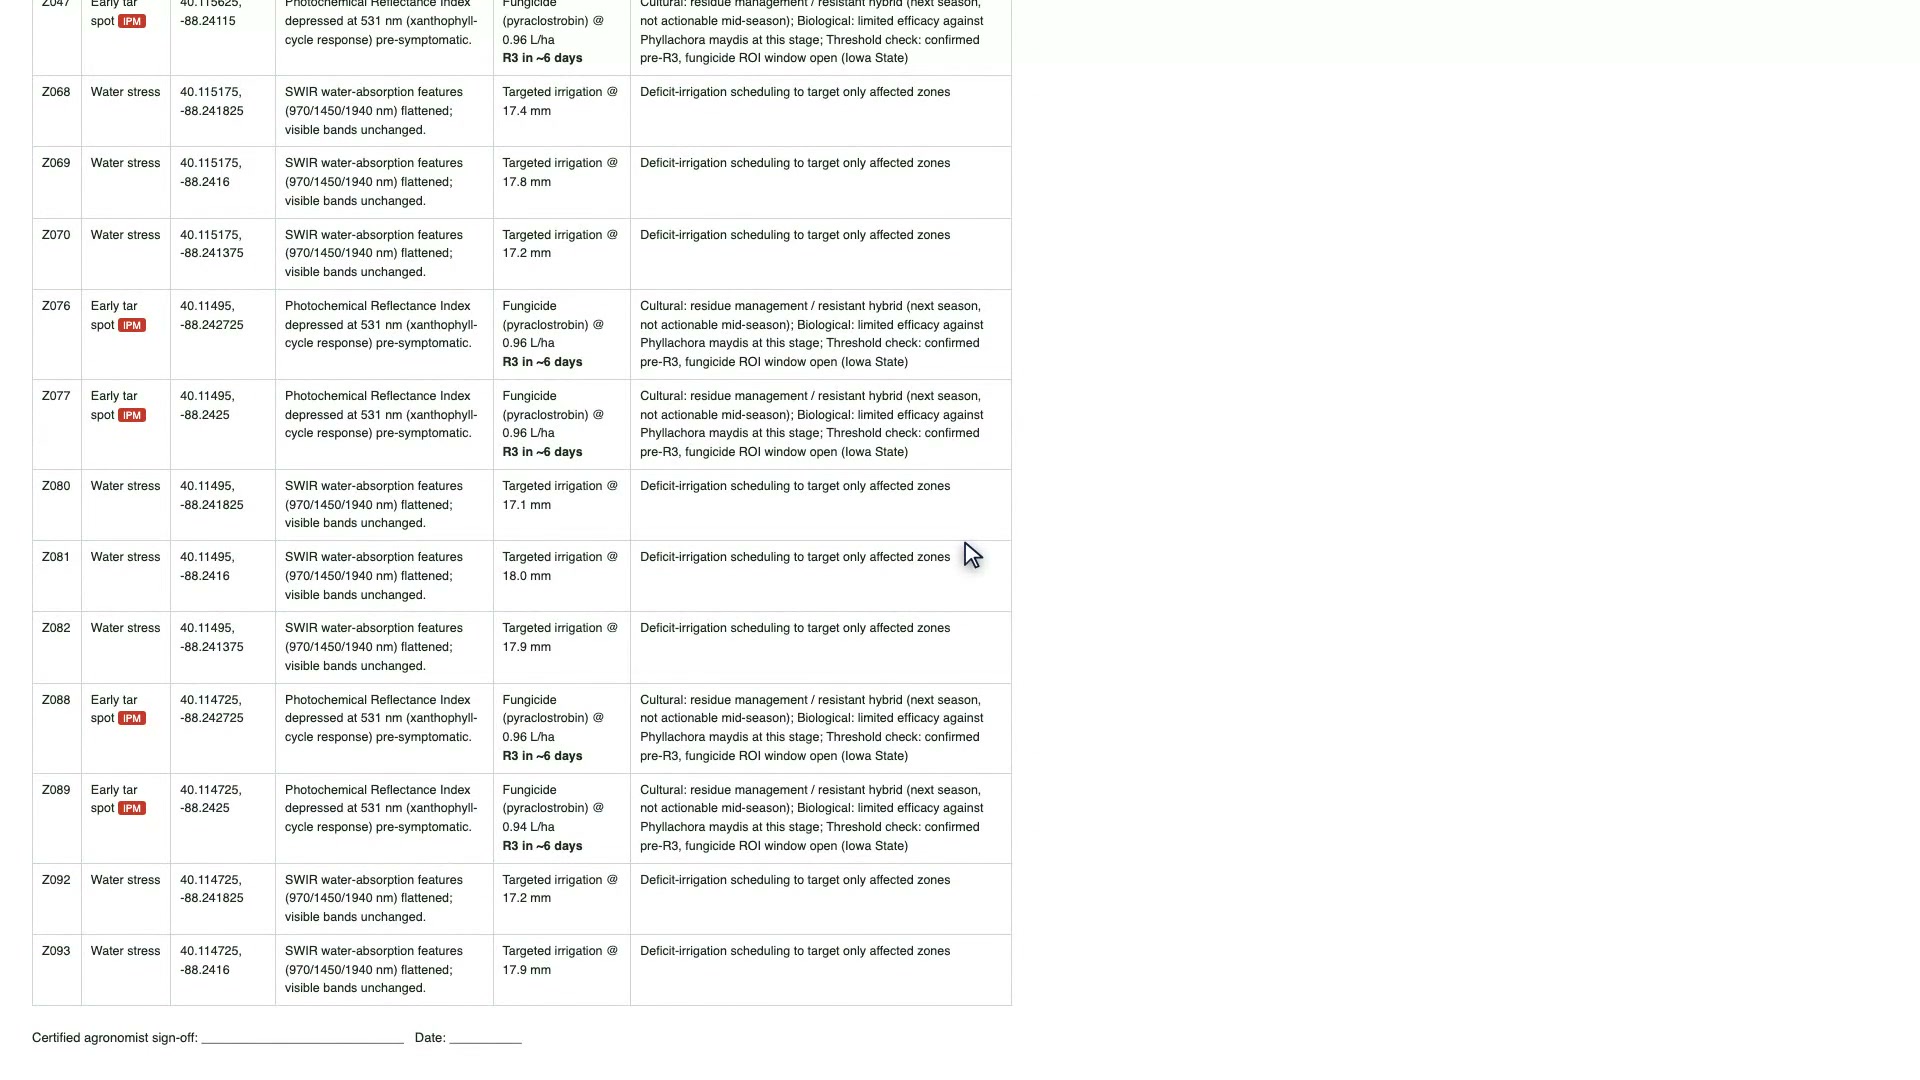 Part of the demo-generated EU Farm-to-Fork IPM-style record template. Each zone carries geo-coordinates, spectral evidence, the product and rate, the R3 fungicide deadline, alternatives evaluated, and a certified-agronomist sign-off line for review.
That is the piece the classifier does not produce and cannot, however good it gets. The optional language model in the system only renders the justification prose from facts already computed. It sits outside the trust path, defaults to a template, and the demo runs with no API key. Putting an LLM in the spectral decision would add no correctness and would cost credibility with anyone who reads 424-band cubes for a living.
Where we actually are
State the boundary plainly. Every scene here is synthetic, physics-grounded from published green-vegetation reflectance with documented stress signatures injected, and the 0.887 is a single-crop, single-geography, held-out synthetic number, not a field guarantee. Real-world accuracy needs the two-season ground-truth library we have not built yet. What the demo settles is the architecture question, and that answer does not depend on the data being real: the classifier is the commodity, and the calibration, the refusal, the equipment math, and the reviewable record template are the system. The full run, including the calibration toggle, is at https://veriprajna.com/demos/hyperspectral-agriculture-ai.
For teams designing variable-rate workflows, the useful comparison is the calibration and abstain checks that belong in the prescription review.