
Your Satellite Sees Stressed Corn. It Can't Tell You Why — and the Wrong Guess Costs $29 an Acre
A few springs ago I stood at the edge of a 200-hectare corn block with an agronomist who had decades on me, and we were both staring at the same amber blob on a tablet. The northeast quarter of the field had lit up on the NDVI map — the standard "vegetation health" index that every satellite monitoring service computes. Something was wrong out there. The map was certain of that much.
What it could not tell us was the one thing that mattered: why.
There were three live possibilities, and they pointed in three opposite directions. It could be nitrogen deficiency, in which case the answer was a variable-rate shot of urea. It could be water stress, in which case dumping nitrogen on it would do nothing and the real fix was irrigation. Or it could be early tar spot — Phyllachora maydis, a fungus that was quietly chewing through the US corn belt — in which case we had a narrow window to spray a fungicide and every day of hesitation cost yield.
Three diagnoses, three opposite moves. And the wrong move wasn't neutral — it was expensive in both directions. Putting nitrogen on a water-stressed block wastes $15 to $25 an acre in fertilizer that the plant can't even take up. Missing the fungicide window on tar spot ran up to $29.75 an acre in Illinois in 2024. The most uncomfortable thing I learned that day is that the wrong response to an ambiguous alert is often worse than no response at all.
That field is why we built hyperspectral AI for precision agriculture — custom spectral models that don't just flag stress, but diagnose its cause early enough to act on. This is the story of how we got there, including the version we built first that didn't work.
The Ceiling Nobody Tells You About
Here's the thing that took me embarrassingly long to internalize: the satellites everyone already uses are doing exactly what they were designed to do. They just weren't designed to answer the question we were asking.
Planet's PlanetScope constellation gives you 8 spectral bands and daily global coverage at three-meter resolution, for about $0.85 per acre per year through FarmQA. Sentinel-2 gives you 13 bands, for free. Both compute NDVI, EVI, NDRE — broadband vegetation indices that track general canopy health beautifully. For deciding which fields need a human to go look, they're excellent and absurdly cheap. I'm not here to tell you to stop using them.
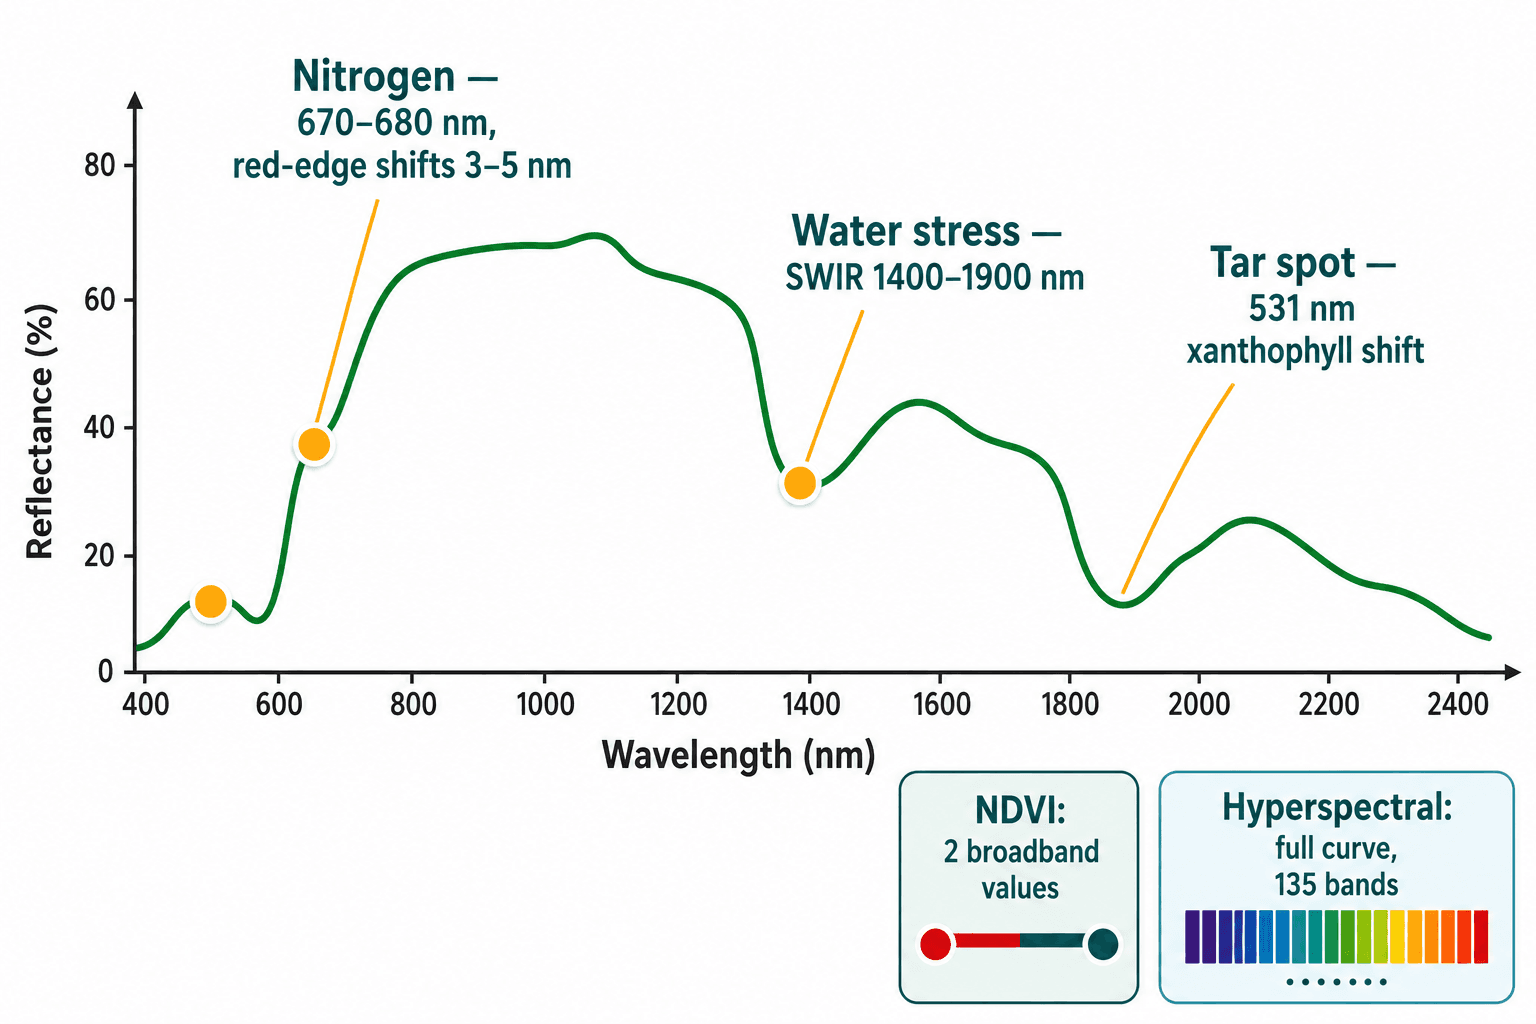
The problem is what happens when you ask one of these indices to distinguish nitrogen from water from fungus. It can't, and not because the software is bad. NDVI takes the entire red and near-infrared range — a continuous curve of how a leaf reflects light at every wavelength — and crushes it into two numbers. Every diagnostic feature that would separate one stress from another gets averaged away before you ever see the data.
NDVI doesn't fail to diagnose the cause of crop stress because it's poorly built. It fails because it's compressing the exact information that holds the diagnosis into two broadband values.
And the three stresses genuinely do live in different parts of the spectrum — that's the part that still feels a little magical to me. Nitrogen deficiency shows up as a drop in chlorophyll absorption around 670–680 nanometers, and the "red edge" inflection point of the reflectance curve slides three to five nanometers toward blue. Water stress barely touches the visible bands until it's severe; its fingerprint is in the shortwave infrared, between 1400 and 1900 nanometers, where the leaf's water-absorption features flatten out as the stomata close. Tar spot is sneakier still — fungal colonization triggers a xanthophyll-cycle response detectable at 531 nanometers before any visible spots appear on the leaf.
If you can read the full curve, those three are as distinct as three different handwriting samples. If you only have NDVI, they're identical.
The Version We Built First — and Why It Broke
I want to be honest about this part, because the clean version of this story ("we saw the problem, we built hyperspectral models, it worked") is a lie of omission.
Our first real build was a tar-spot detector. We had hyperspectral imagery — 135 narrow bands — and we trained a 3D convolutional neural network, a model architecture that reads the spectral curve at every single pixel rather than treating the image as flat RGB. On public datasets and held-out test imagery, it was great. The accuracy numbers were the kind you put on a slide. I remember being genuinely proud of it.
Then we pointed it at a real grower's field, on a real crop variety, in a real geography, and it fell apart.
The model had learned to recognize tar spot the way it appeared in the data it was trained on. But spectral signatures shift with crop variety, growth stage, soil background, even the angle of the sun. What we'd actually built was a detector that worked beautifully on the past and shrugged at the present. The expensive, unglamorous truth is that the model was never the hard part. The hard part was ground truth — field-verified labels, where a human physically samples a leaf and confirms what's wrong with it, so the model learns what this crop's tar spot looks like in this field.
Field-validated hyperspectral samples run $50 to $200 each. There is no large, clean, public library of them for most crops and most regions. That bottleneck is precisely why the off-the-shelf platforms don't solve this: building a spectral disease library for a specific crop and geography isn't a software feature you can ship to everyone. It's consulting work — domain expertise plus an agronomic partnership to collect the labels — done once, for one operation, and it's where I'd watched cheaper approaches quietly give up.
That failure is the reason we changed how we work. We stopped selling a model and started building a pipeline that begins with the grower's own field and their agronomist's knowledge, not with a pre-trained classifier looking for somewhere to land.
Why Is Earlier Detection the Whole Game?
When the diagnosis is right, the second prize is time, and in crop disease time is almost everything.
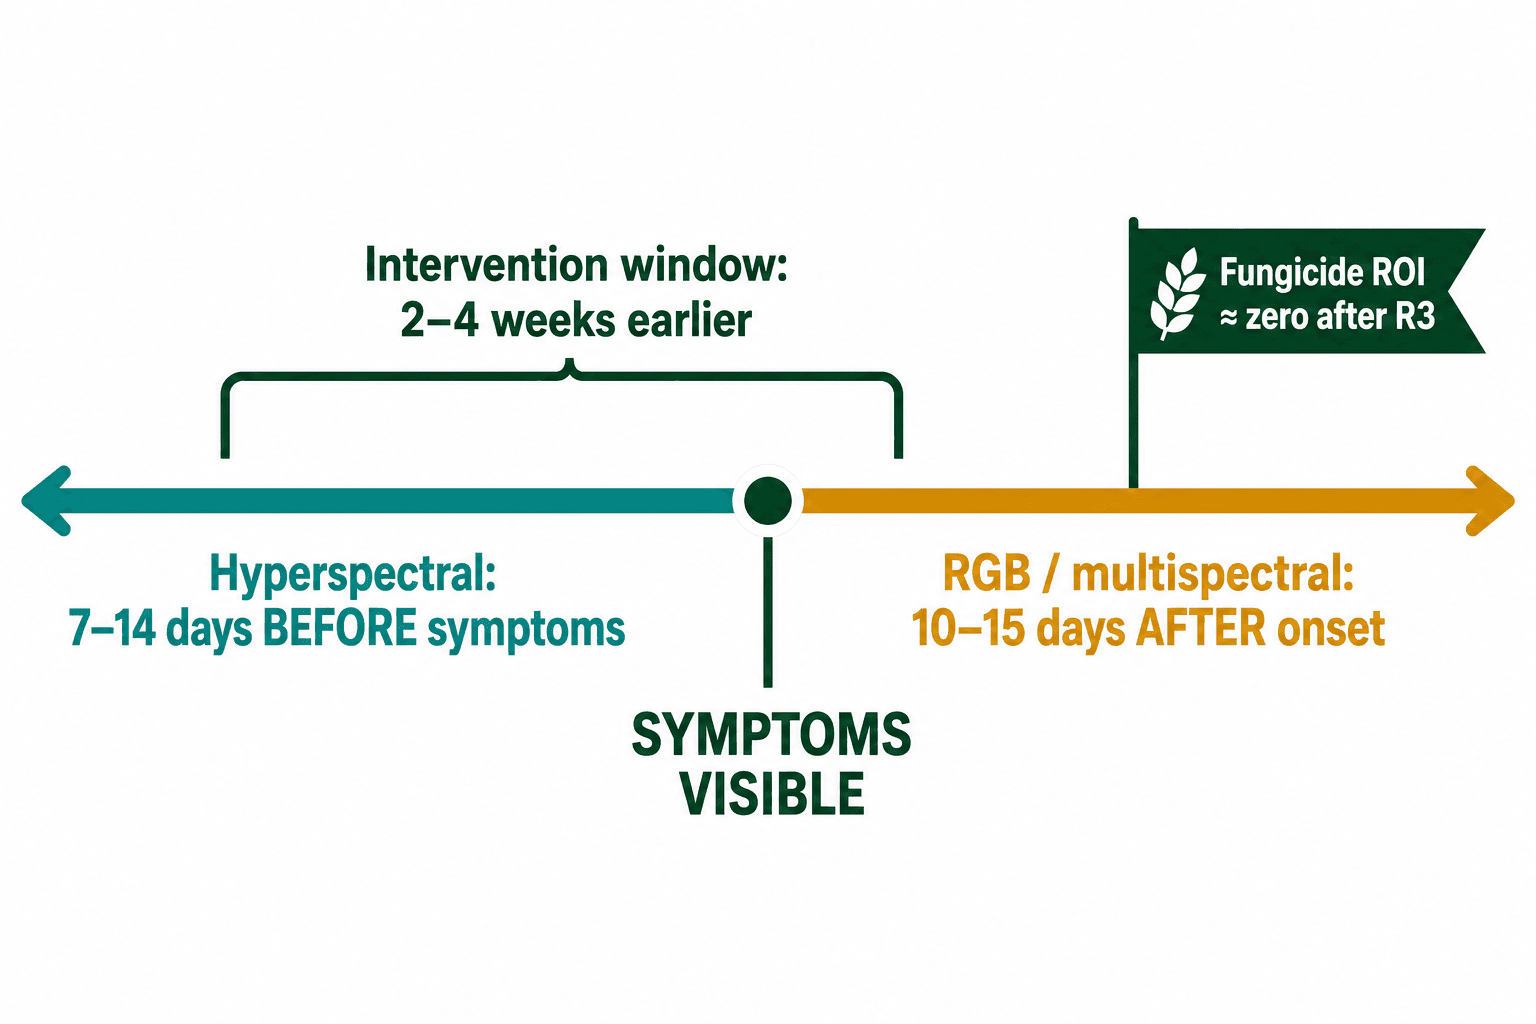
Standard RGB and multispectral monitoring tends to catch damage 10 to 15 days after onset — which is to say, after the plant already looks sick. By then a chunk of the yield loss is locked in and irreversible. Hyperspectral models reading those biochemical shifts catch stress 7 to 14 days before visible symptoms. Stack those together and you've moved your intervention window forward by two to four weeks. That's the difference between spraying inside the window where it still pays and spraying after the fungus has won.
The economics here aren't subtle. US corn lost 963 million bushels to disease in 2024 — about 6% of the crop — and tar spot alone accounted for 280 million of those bushels. Soybeans lost another 250 million. Against that backdrop, AI-based early detection has been shown to prevent somewhere between 15% and 40% of yield loss, with ROI north of 150%. And timing isn't just about catching it early; it's about not spraying when you shouldn't — a decision-support approach can halve fungicide use compared to spraying on a calendar, which matters more every year.
Detection answers "is something wrong." Diagnosis answers "what, and should I act today." Only one of those changes what you do tomorrow morning.
There's a hard deadline buried in the fungicide math, too. Iowa State's pathology data shows that once corn passes the R3 growth stage, fungicide ROI drops to near zero. Spray before R3 and it pays; spray after and you've burned the chemical and the diesel for nothing. A "stress" alert with no cause and no growth-stage awareness can't tell you which side of that line you're on. A spectral model trained on your crop can.
The Last Mile Is Where Most of This Dies
A diagnosis is a sentence; a prescription map is a machine instruction. Almost all the engineering lives in the translation between the two — everything between a spectral diagnosis and a tractor actually doing something different.
A spectral diagnosis is only useful if it becomes a variable-rate prescription map the sprayer can actually execute — one that respects boom width, nozzle spacing, and the minimum application rate the equipment can physically lay down. A map that prescribes a precise dose of urea to a tight little polygon is worthless if the machine's smallest controllable zone is bigger than the polygon. I've watched genuinely good analytics die at this exact handoff, because the people who built the model had never stood next to the equipment.
Most teams treat the model as the product. In agriculture, the model is the easy part — the prescription map a real sprayer will accept is the product.
When that handoff works, the variable-rate side pays. Done well, VRT can cut fertilizer use by up to 25% while holding yield, and USDA's own economists peg precision practices at 3.7–3.9% production-cost savings per acre on corn. But "done well" is load-bearing — Corn Belt studies show variable-rate nitrogen swinging from minus $410 per hectare in a bad match to plus $350 in a good one. The spread between those two outcomes is the analytics layer. That's the part we build.
And starting in January 2026, there's a second last-mile problem that I think a lot of operators are underestimating: compliance. The EU's Farm to Fork rules now require electronic spray records with geospatial data, updated within 30 days, with certified-agronomist sign-off under integrated pest management. A spectral monitoring system that already knows what was applied where, and when, is most of the way to generating those records automatically. Most growers I talk to see this as a paperwork burden. I see it as a reason the spectral pipeline pays for itself twice.
So Who Actually Builds This?
This is the question I'd put on the screen in your next vendor meeting, because the honest answer surprises people: almost nobody builds the layer you actually need.
Pixxel flies six operational hyperspectral satellites with 135 bands and sells the data through UP42 and SkyFi — and their Honeybee Zero satellites, planned for 2026, finally add the shortwave-infrared bands you'd need for water stress. But Pixxel sells data, not crop-specific models, and their current 14-day minimum tasking window can miss a fast-moving disease event. Planet's Tanager-1 covers the full 400–2500nm range, but it was built for methane and carbon monitoring, not agronomy. Bayer's Climate FieldView is the most connected platform in the industry — 150 million-plus acres subscribed — but it ingests imagery and performs no spectral analysis of its own; it executes prescriptions, it doesn't make them. The drone-sensor vendors — Headwall, Specim, Resonon — sell you gorgeous instruments for $50,000 to $150,000 and then hand you a raw data cube with no models. And the big consultancies? Accenture bought a European precision-ag analytics firm in early 2025, but a strategic advisory engagement runs $500,000 to several million and still ends with someone else needing to build the actual pipeline.
Every one of those players is good at the thing they do. The gap is the connective tissue: the custom spectral models, the field-collected disease library, and the prescription-and-compliance integration that turns 135 bands of reflectance into something a sprayer and a regulator both accept. We don't own satellites and we don't manufacture sensors — we sit on top of Pixxel, Planet, or drone imagery the grower chooses, and we build that missing layer.
People ask me whether this only makes sense for giant row-crop operations. It's actually the high-value specialty crops where the math is most obvious. A California vineyard using hyperspectral imaging and AI cut fungicide use 22% while holding grape quality; in Napa, where Cabernet fruit can be worth $10,000 to $30,000 an acre, spending $50 to $100 an acre on monitoring isn't a hard sell — it's rounding error against the downside.
The other question I get, always, is some version of "why should I trust another agtech startup?" It's fair. Venture funding in agtech fell more than 25% in 2024, and at least 28 vertical-farming companies went under — a lot of growers got burned by founders who promised a proprietary platform and then folded. My answer is that we're deliberately not that. We don't ask you to bet on our satellites or our SaaS surviving. We build custom analytics on infrastructure that already exists and that you can keep using if we vanish. After the startup graveyard of the last two years, that's not a limitation. It's the only trustworthy way to sell into a field this skeptical.
The Real Lesson
Only 27% of US farms use precision agriculture at all, and the barrier was never the technology — it was that the technology produced alerts instead of answers. A color-coded stress map doesn't change anyone's behavior. A diagnosis that says water stress, irrigate the northeast quarter, don't waste the nitrogen does.
I went into that cornfield thinking the problem was resolution — that we just needed sharper, more frequent images. I came out understanding that the problem was the question. NDVI was answering "is this field healthy" with great precision, when the grower was asking "what do I do on Tuesday." Those are different questions, and no amount of the first one ever adds up to the second.
If you're staring at your own version of that amber blob — certain something's wrong, unable to act on it — that's the gap we built Veriprajna's hyperspectral analytics to close. Not to tell you the field is stressed. You already know that. To tell you why, in time to do something about it.


