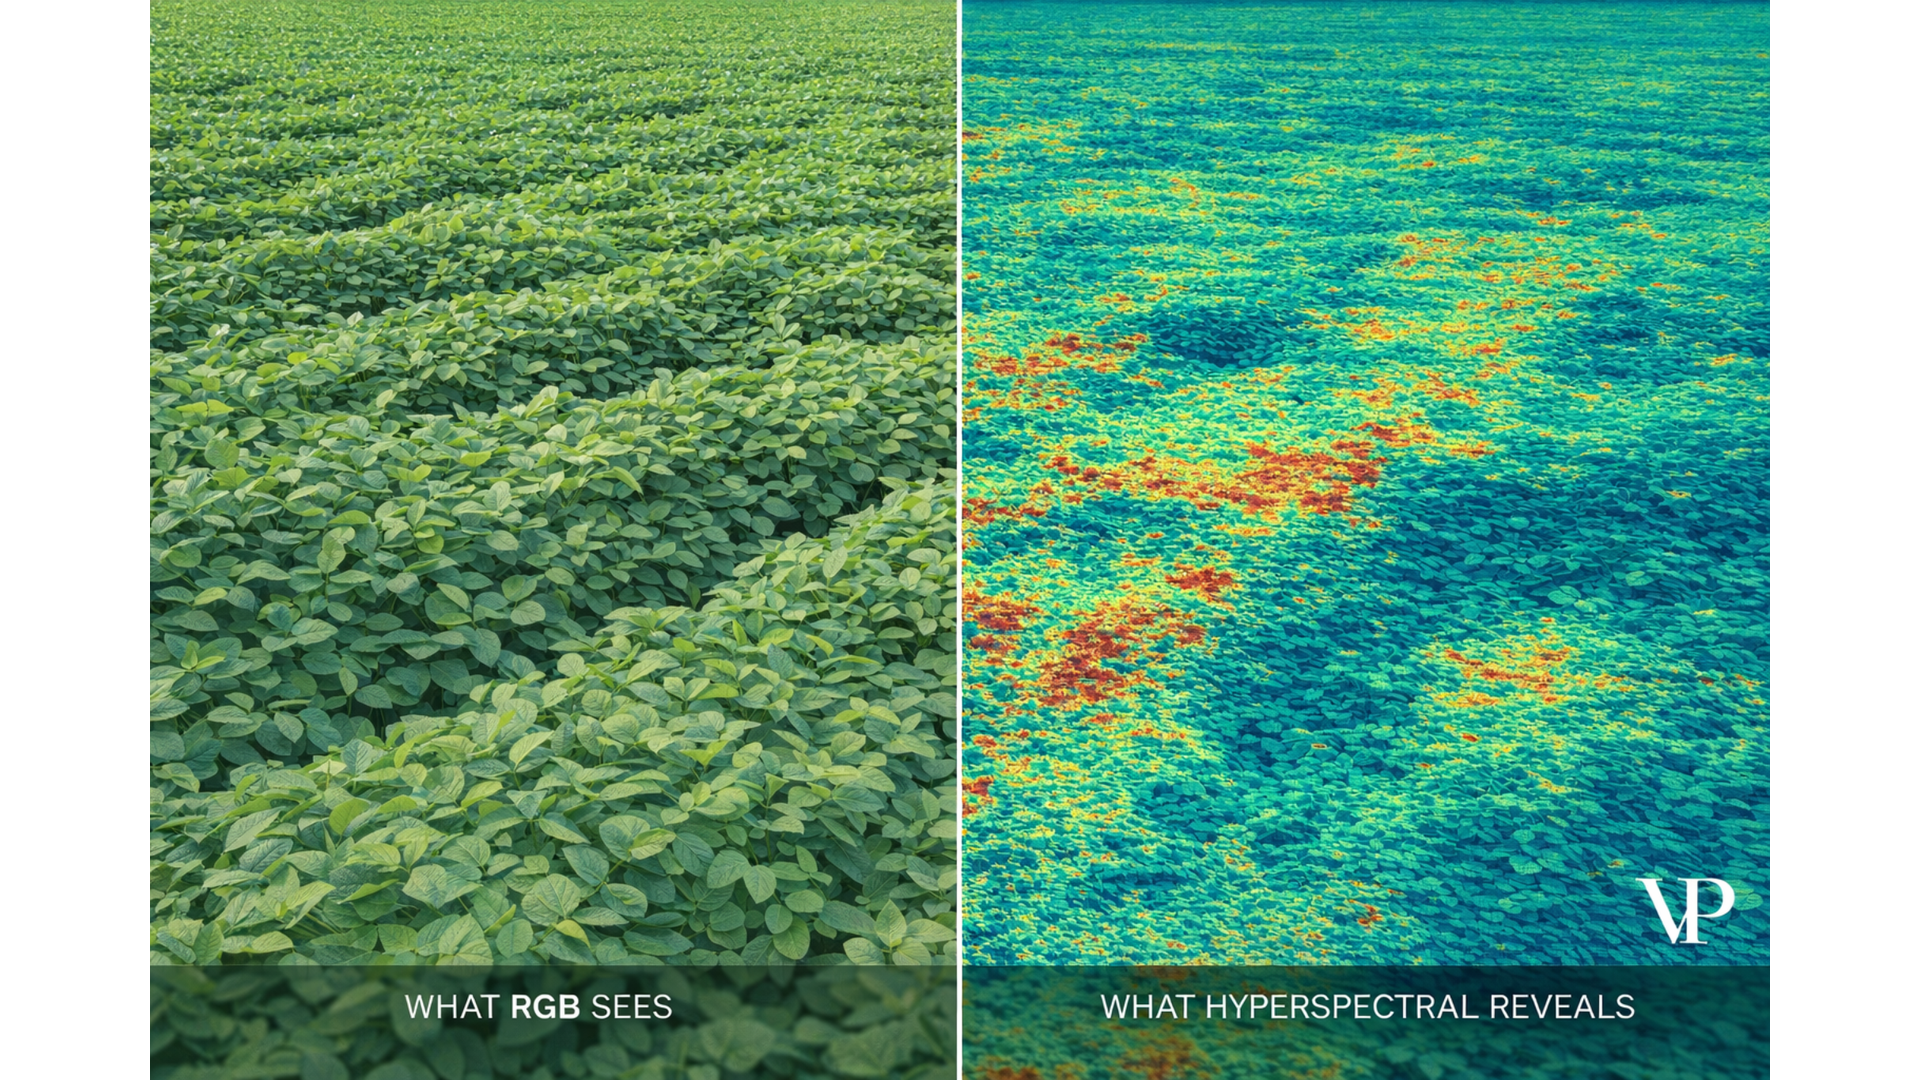
A soybean field in Iowa looks perfectly healthy. Lush, green, thriving. Two weeks later, it's devastated — yield down 30%, fungal damage everywhere. The farmer's satellite monitoring system, the one powered by AI and standard camera imagery, never raised an alarm. It saw green. It reported "healthy." It was wrong.
This isn't a hypothetical. It's the default failure mode of agricultural AI today, and it stems from a deceptively simple problem: the entire industry is using the wrong kind of camera. Standard Red-Green-Blue (RGB) imagery — the same technology in your phone — captures what the human eye sees. But crop stress doesn't start where the human eye can see it. It starts in the chemistry of the leaf, in wavelengths of light we're blind to. By the time a stressed plant looks different to a standard camera, the damage is already done.
We call this the agricultural industry's "JPEG problem." And hyperspectral deep learning is the fix.
The Green Trap: Why Your Satellite AI Is Blind
A plant can be dying and still look green. Agronomists have known this for decades, but the AI systems deployed across enterprise agriculture haven't caught up.
When a crop encounters drought, disease, or nutrient deficiency, the first thing that changes isn't color — it's photosynthetic efficiency. The plant's internal chemistry shifts. Chlorophyll production slows. Water absorption patterns change. These shifts alter how the plant reflects light in very specific, very narrow wavelength bands — bands that sit outside what any standard camera can capture.
A standard RGB camera compresses the entire electromagnetic spectrum into three broad buckets. That's like diagnosing a patient's bloodwork by asking "is it red?"
Standard agricultural AI uses Convolutional Neural Networks (CNNs) — pattern-recognition models originally designed to identify cats in photos and cars on streets — applied to these three-channel images. These models excel at detecting shapes, edges, and textures. They can tell you "this is a corn field" or "this is a tractor." What they cannot tell you is whether that corn field is photosynthetically efficient, because that answer lives in wavelengths the camera never recorded.
The result is a detection delay of 10 to 15 days. By the time an RGB-based model spots a change in leaf color or field texture consistent with "stress," the crop has already suffered yield-limiting damage. The shape of a dying crop is a post-mortem indicator. The spectrum of a stressed crop is a vital sign.
Reading Light Like a Blood Test
Hyperspectral imaging flips the paradigm. Instead of three broad color channels, a hyperspectral sensor captures 200 or more narrow, contiguous bands of light — spanning visible wavelengths, near-infrared, and short-wave infrared. Each pixel isn't a color; it's a full chemical fingerprint.
Think of it this way: an RGB image is like looking at a patient and saying "they look pale." A hyperspectral image is like running a complete blood panel — chlorophyll concentration, water content, cellular structure, nutrient levels — for every square meter of a field, from orbit.
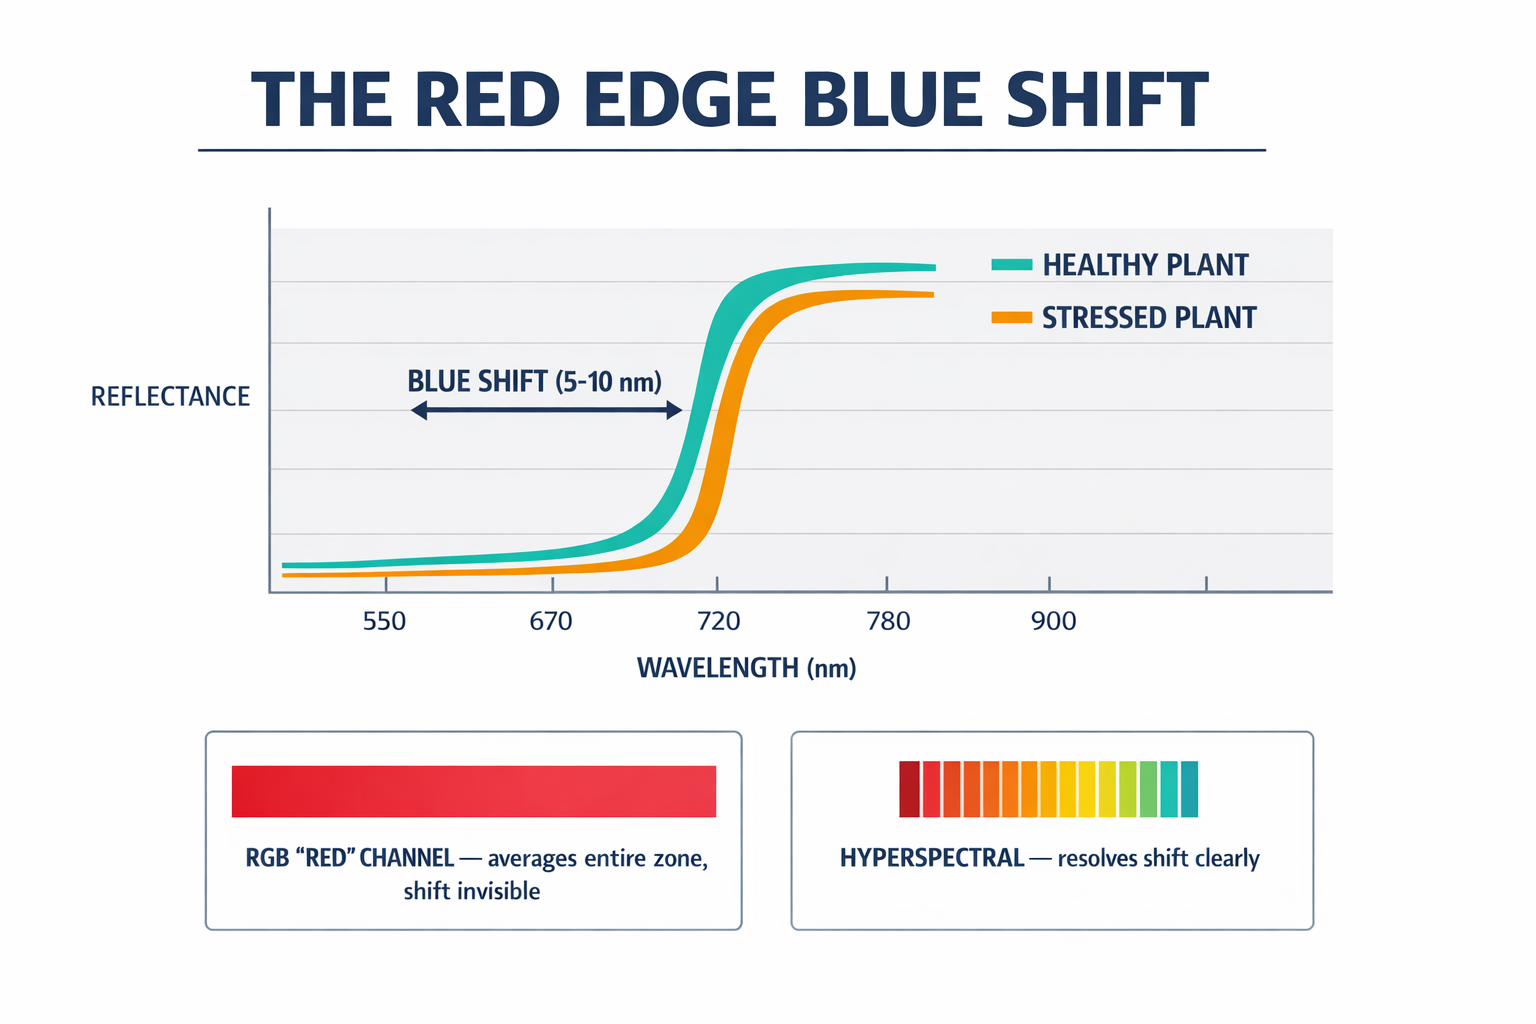
The key mechanism is something called the Red Edge — a sharp cliff in the reflectance curve between the red band (around 670 nanometers, where chlorophyll absorbs light intensely) and the near-infrared band (around 780 nanometers, where healthy cell structures scatter light back). In a healthy plant, this cliff is steep. When stress hits, the cliff shifts — migrating toward shorter wavelengths by just a few nanometers at a time.
This "Blue Shift" is measurable, predictable, and diagnostic. But a standard RGB camera, which lumps everything from 600 to 700 nanometers into a single "Red" channel, physically cannot detect a 5-nanometer shift. It averages the signal out. A hyperspectral sensor resolves it clearly.
Our models use this Blue Shift as a primary feature. We've explored the full physics and methodology in our interactive analysis, but the practical upshot is straightforward: we can predict harvest failure while the field still appears verdant to every standard monitoring system on the market.
Why Standard AI Architectures Fail on Spectral Data
The problem isn't just the camera — it's the math behind the AI.
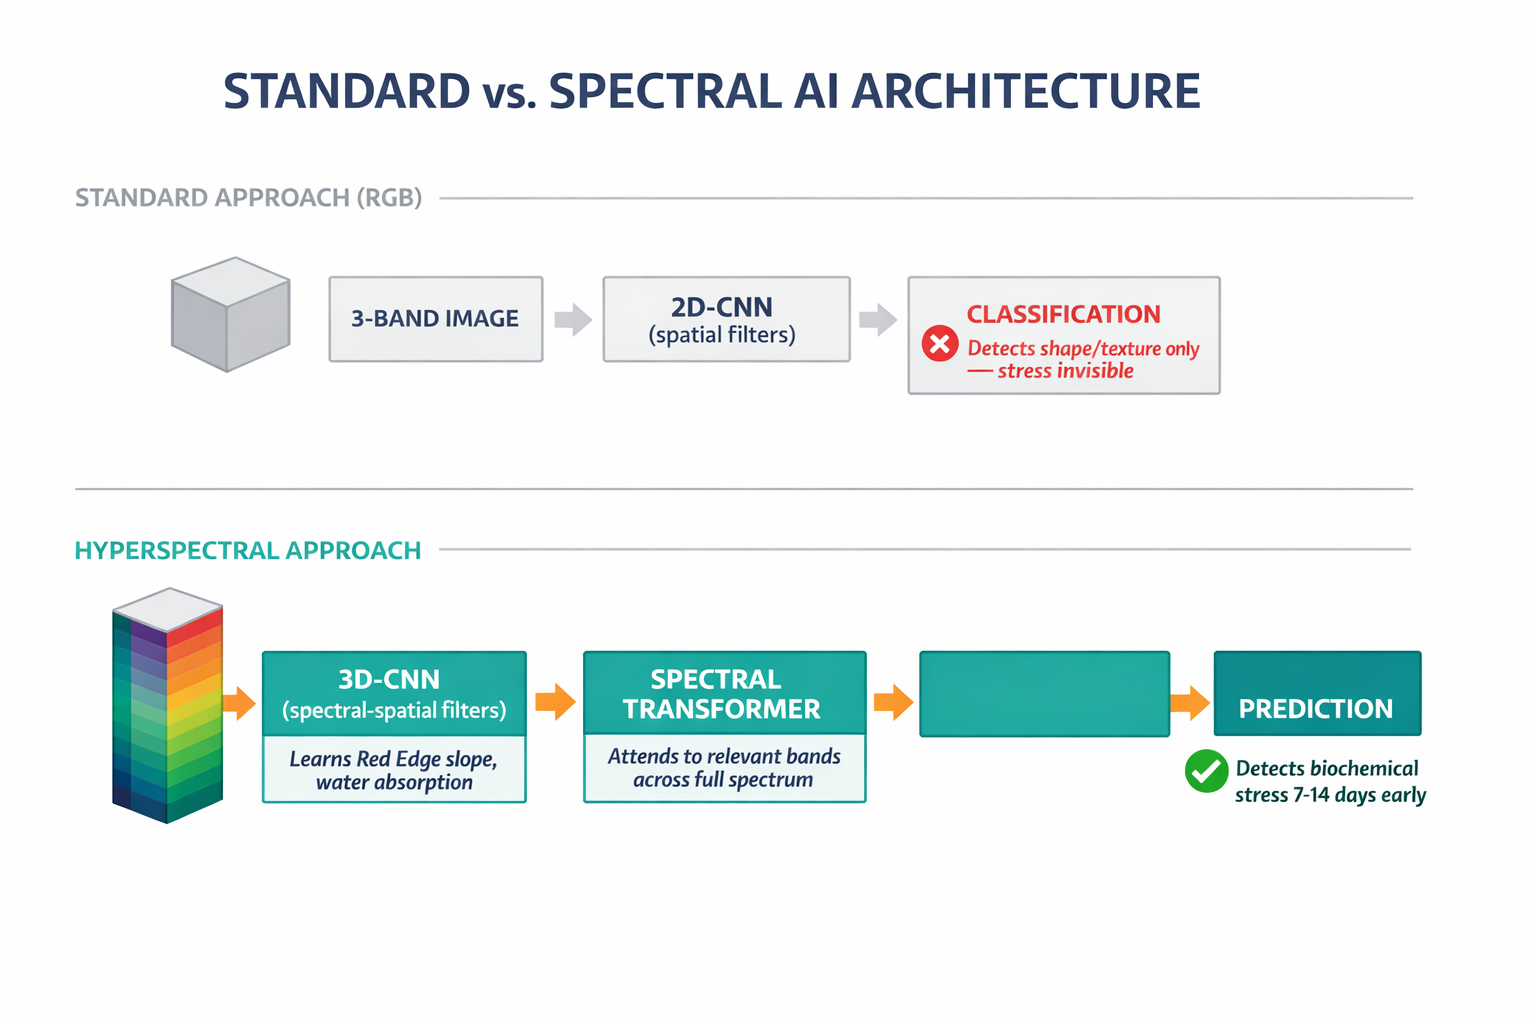
A standard 2D-CNN processes an image by sliding a small filter across the spatial dimensions (height and width), summing across all color channels at each position. For a three-channel RGB image, this works fine — the channels are highly correlated and carry similar spatial information. For a 200-band hyperspectral image, it's destructive. The network crushes the spectral dimension in its very first operation, forcing itself to rely on spatial textures — the wrong signal for early stress detection.
There's a second trap. With 200+ bands per pixel, the data is extremely high-dimensional. Classical machine learning hits what's called the Hughes Phenomenon: beyond a certain point, adding more data dimensions actually degrades model performance because the feature space becomes so vast that the model overfits to noise instead of learning the signal. The standard fix — using Principal Component Analysis to compress 200 bands down to 10 or 20 — is a linear shortcut that can discard exactly the subtle, non-linear spectral features that distinguish nitrogen deficiency from fungal infection.
The "curse of dimensionality" isn't a curse at all. It's a wealth of information — if you use architecture designed to handle it.
And then there's the transfer learning shortcut: taking a model like ResNet-50, pre-trained on millions of internet photos (dogs, cars, lamps), and "fine-tuning" it on satellite data. The statistical distribution of a radiometric image is nothing like a consumer photograph. An ImageNet model has learned to detect eyes, wheels, and fur. None of those features exist in a corn field. The knowledge transfer is minimal and often counterproductive.
Building AI That Reads the Spectrum
Our approach uses architectures where the spectral dimension is a first-class citizen, not an afterthought.
3D Convolutional Neural Networks extend the standard convolution into a third dimension — depth, meaning spectral bands. The filter slides not just across the image but through the spectrum, learning features that are simultaneously spatial and spectral. It can detect the slope of the Red Edge or the depth of a water absorption feature directly from raw data, preserving the inter-band correlations that define what a plant is actually made of.
For patterns that span the full spectrum — connecting a visible-range signature with a short-wave infrared water absorption pattern hundreds of bands away — we deploy Spectral-Spatial Transformers. These use attention mechanisms (originally developed for language processing) to dynamically focus on whichever spectral bands matter most for a given prediction. When assessing drought stress, the model learns to "attend" to the relationship between Red Edge bands and SWIR water bands while ignoring irrelevant noise. No static band selection required — the model adapts to context.
Our production systems combine both: a 3D-CNN front-end extracts local spectral-spatial features, and a Transformer back-end models the global context. The full architectural details are in our technical deep-dive.
One critical innovation addresses the biggest bottleneck in agricultural AI: labeled data. Physically verifying crop health on the ground is expensive and unscalable. We use Self-Supervised Learning — training models to reconstruct masked spectral bands from the remaining ones, forcing the network to learn the physics of plant reflectance without a single human label. Recent benchmarks show these approaches achieving over 92% accuracy in early disease detection, matching fully supervised methods while eliminating the need for armies of agronomists in every county.
The Numbers: What Early Detection Is Worth
The economic case comes down to a single variable: time.
Information received after the point of intervention has zero value. An alert that says "your field is damaged" is an insurance claim. An alert that says "your field will be damaged in two weeks" is an intervention opportunity.
Research shows AI-based early disease detection can prevent yield losses of 15–40%, with ROI on the detection technology often exceeding 150%. For an enterprise managing thousands of hectares, that's millions of dollars in retained revenue per season. Detecting stress 7 to 14 days pre-symptomatically — before any visible change — allows targeted fungicide application when it's most effective and cheapest, rather than blanket spraying after the disease has established.
Hyperspectral AI doesn't just find problems faster. It finds them while they're still solvable.
The results extend beyond disease. Hyperspectral models can quantify leaf nitrogen content precisely enough to reduce fertilizer application by 10% across a portfolio — improving margins while cutting environmental runoff. Thermal and short-wave infrared bands provide direct proxies for crop water stress, enabling irrigation optimization that can reduce water usage by 20–25%.
This isn't theoretical. Descartes Labs used spectral satellite data and machine learning to forecast US corn production with a statistical error of just 2.37% in early August — weeks before the USDA's official survey data reached comparable accuracy. In an 11-year backtest, their spectral models beat USDA forecasts at every point in the growing season. Planet Labs partnered with Organic Valley to optimize grazing using satellite-derived spectral data, increasing pasture utilization by 20%. Gamaya deployed hyperspectral drones over Brazilian sugarcane fields and detected nematode infestations and nutrient deficiencies that RGB drones missed entirely.
What About the Data Infrastructure Challenge?
A fair objection: hyperspectral data is massive. A single hyperspectral image can be 50 to 100 times larger than a standard RGB satellite image. A single flight campaign generates terabytes. Isn't this impractical?
It's an engineering problem, not a fundamental barrier. Cloud-native architectures using chunked, compressed array formats allow GPU clusters to ingest specific spectral slices in parallel rather than loading entire images. The preprocessing pipeline is non-trivial — atmospheric correction to strip out water vapor and aerosol distortion, geometric co-registration to ensure the same pixel maps to the same patch of ground across time — but these are solved problems with physics-based models that can be accelerated by neural network approximations.
The more interesting frontier is processing data in orbit. Transmitting terabytes from space to Earth is slow and expensive. Lightweight 3D-CNNs and quantized Transformers running on satellite hardware can transmit the insight ("Field A has rust") rather than the raw data, cutting latency from hours to minutes. Meanwhile, new missions like Planet's Tanager, Germany's EnMAP, and NASA's upcoming Surface Biology and Geology satellite are dramatically increasing the availability of high-quality hyperspectral data globally.
Doesn't NDVI Already Solve This?
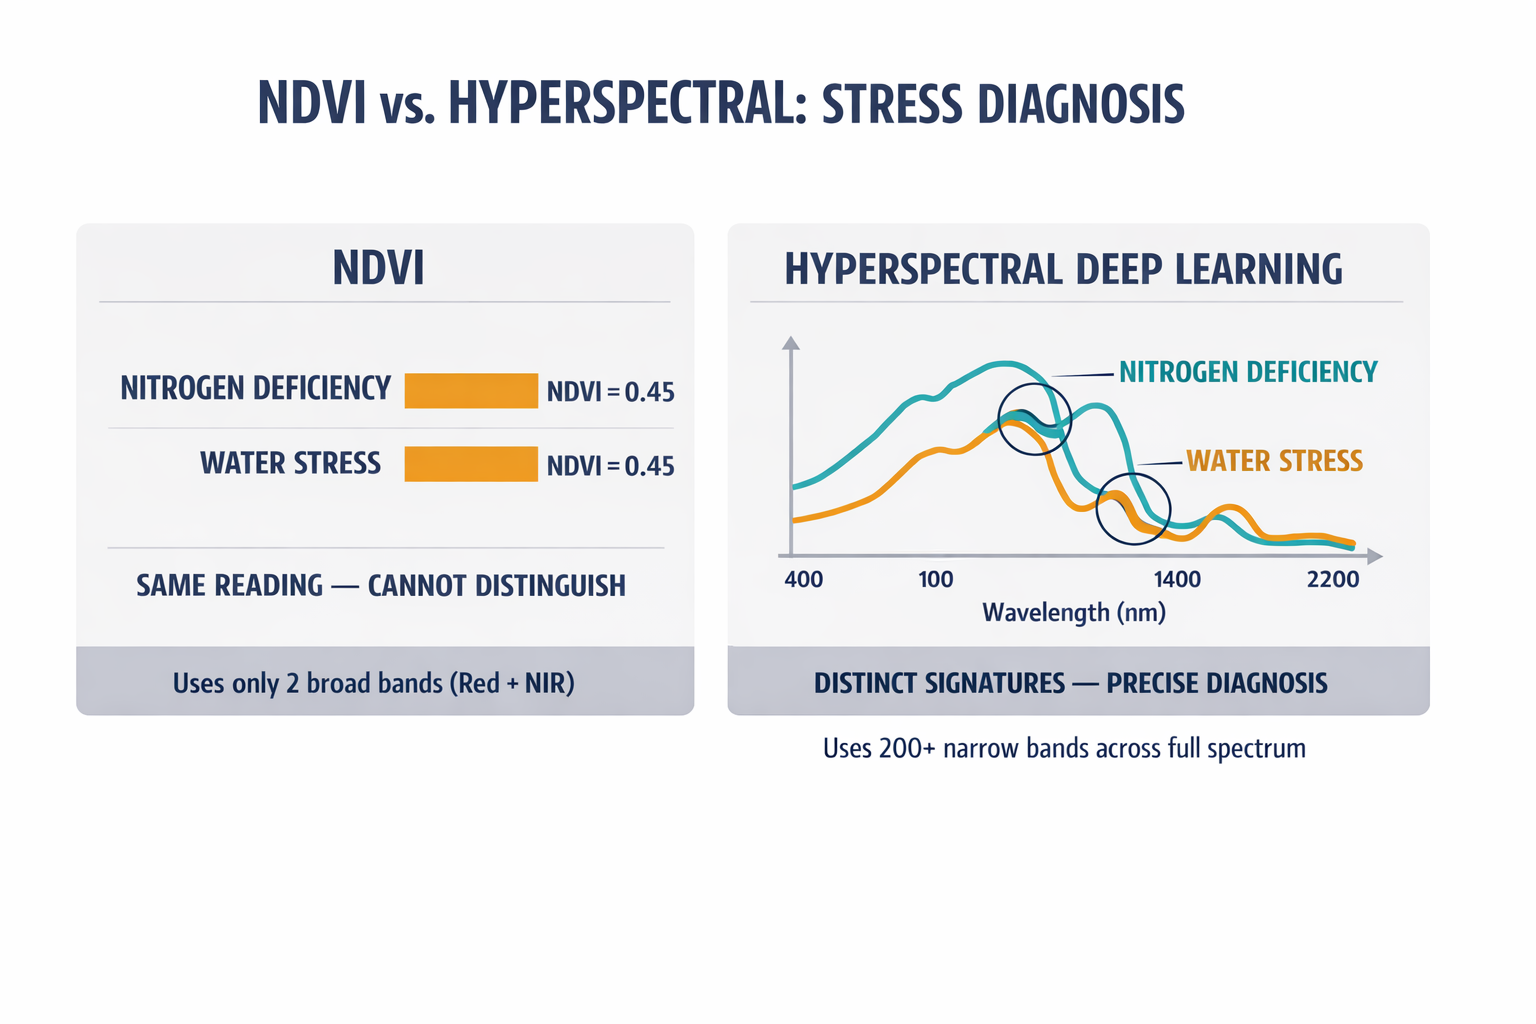
NDVI — the Normalized Difference Vegetation Index — has been the industry standard for decades. It's a simple ratio: (Near-Infrared minus Red) divided by (Near-Infrared plus Red). It correlates with general biomass and is easy to compute.
It's also a blunt instrument. NDVI treats the entire "Red" region and entire "NIR" region as single blocks, saturates in dense canopies, and critically, cannot distinguish types of stress. Nitrogen deficiency and water stress produce similar NDVI readings but look completely different across the full spectrum — nitrogen deficiency primarily affects visible and Red Edge regions, while water stress shows up in the SWIR bands.
Hyperspectral deep learning doesn't replace NDVI with a better index. It replaces the entire concept of hand-crafted indices with learned, non-linear spectral features that no manual formula can capture — like detecting the specific absorption signature of a fungal pathogen at exactly 531 nanometers.
What This Means for Enterprise Agriculture
The transition from RGB to spectral AI isn't a feature upgrade. It's a category shift — from reactive damage assessment to predictive biochemical monitoring.
For enterprise agricultural operations, the implications are concrete:
Yield protection moves from post-mortem to pre-symptomatic, with a 7-to-14-day early warning window
Input costs drop as precision application replaces blanket spraying
Water usage decreases 20–25% through spectral-based irrigation scheduling
Insurance and commodity risk improve with verifiable, tamper-resistant spectral data tied to actual plant physiology
Maps are not pictures. They are data. Treat them accordingly.
The satellite instruments orbiting Earth right now are scientific radiometers, not cameras. They measure photon radiance across specific wavelengths with extraordinary precision. Every time that data gets compressed into a JPEG for the convenience of a standard AI model, intelligence is destroyed. The industry has been treating scientific instruments like iPhone cameras, and the cost is measured in billions of dollars of lost yield and wasted inputs annually.
We think that era is ending. The question for enterprise agriculture isn't whether to make this transition, but how quickly. We'd welcome hearing how your organization is thinking about it.