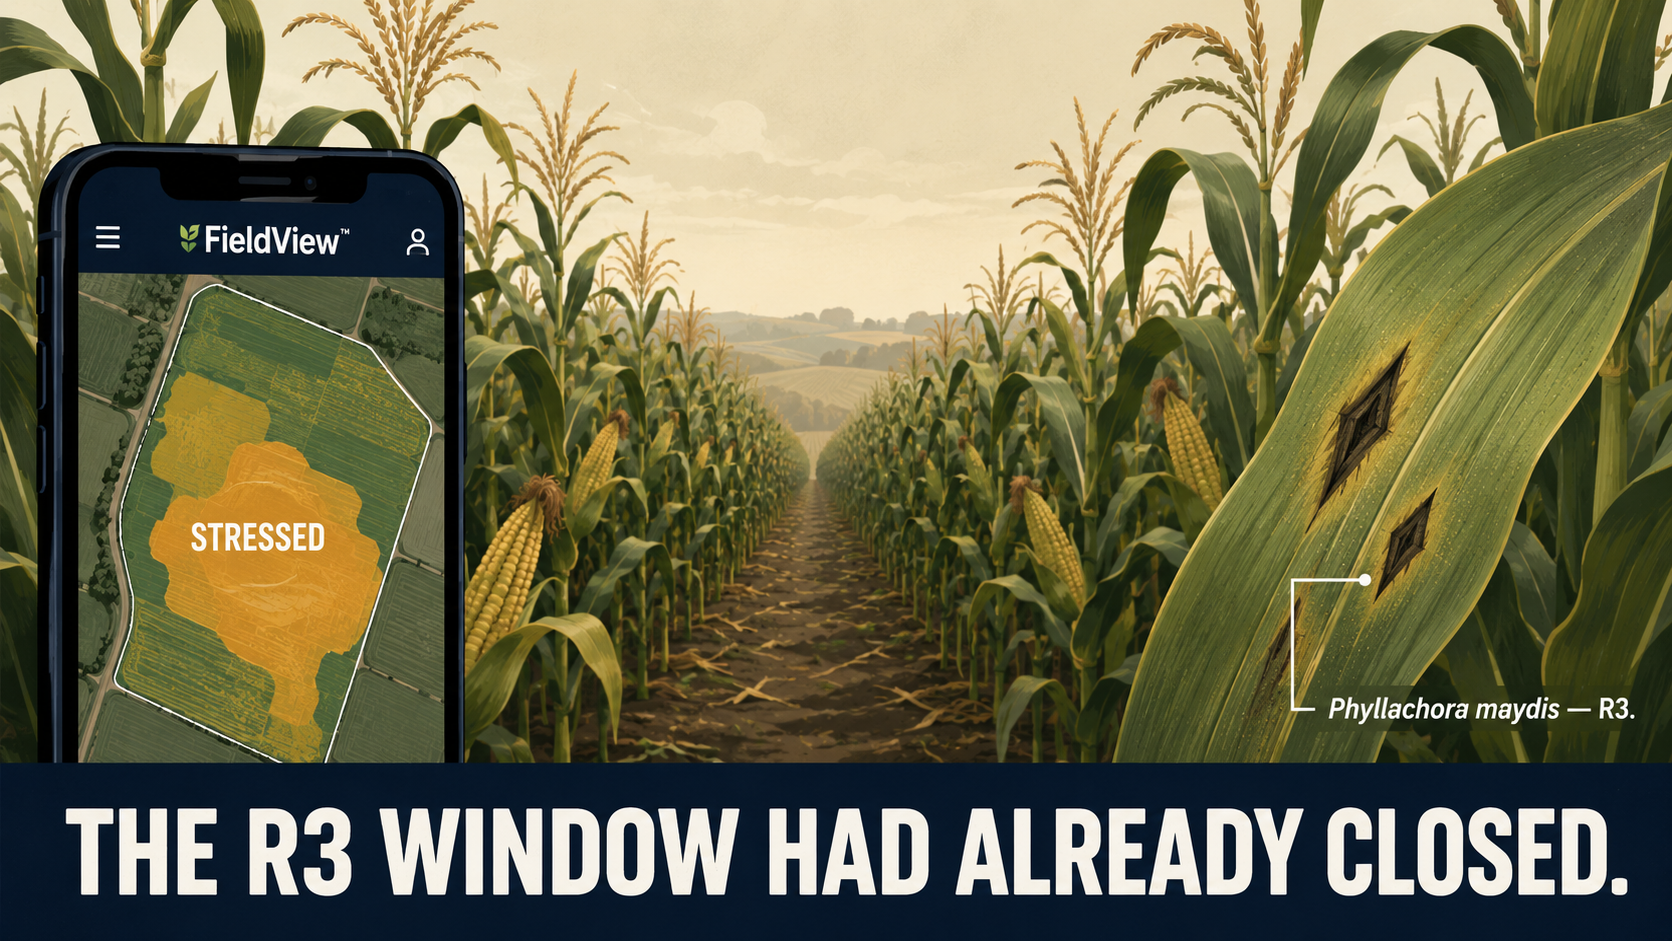
The agronomist I was walking the field with had applied nitrogen to the northeast quarter two weeks earlier. FieldView had flagged the block as stressed, and nitrogen deficiency was the most plausible diagnosis for the canopy depression she was seeing. By the time we were in the field together, tar spot lesions were visible at R3–R4 — past the fungicide window. The nitrogen application hadn't made things catastrophically worse, but it hadn't addressed what the field actually needed, and the intervention that might have saved $29.75 per acre had quietly expired. The yield loss on that block was locked in from the moment the stress alert fired without a diagnosis attached to it.
That walk changed something in how I frame the precision agriculture problem. The alert was correct. The monitoring was working. The missing piece was a diagnosis layer that distinguished nitrogen deficiency from water stress from early Phyllachora maydis — and that layer doesn't come bundled with any satellite subscription or farm management platform I've seen.
The Alert Was Working Exactly as Designed
I spent time before that field visit assuming the problem was detection latency — that NDVI caught stress 10–15 days after onset, and the fix was earlier detection. What I hadn't thought through carefully enough was that earlier detection of the wrong diagnosis still produces the wrong prescription.
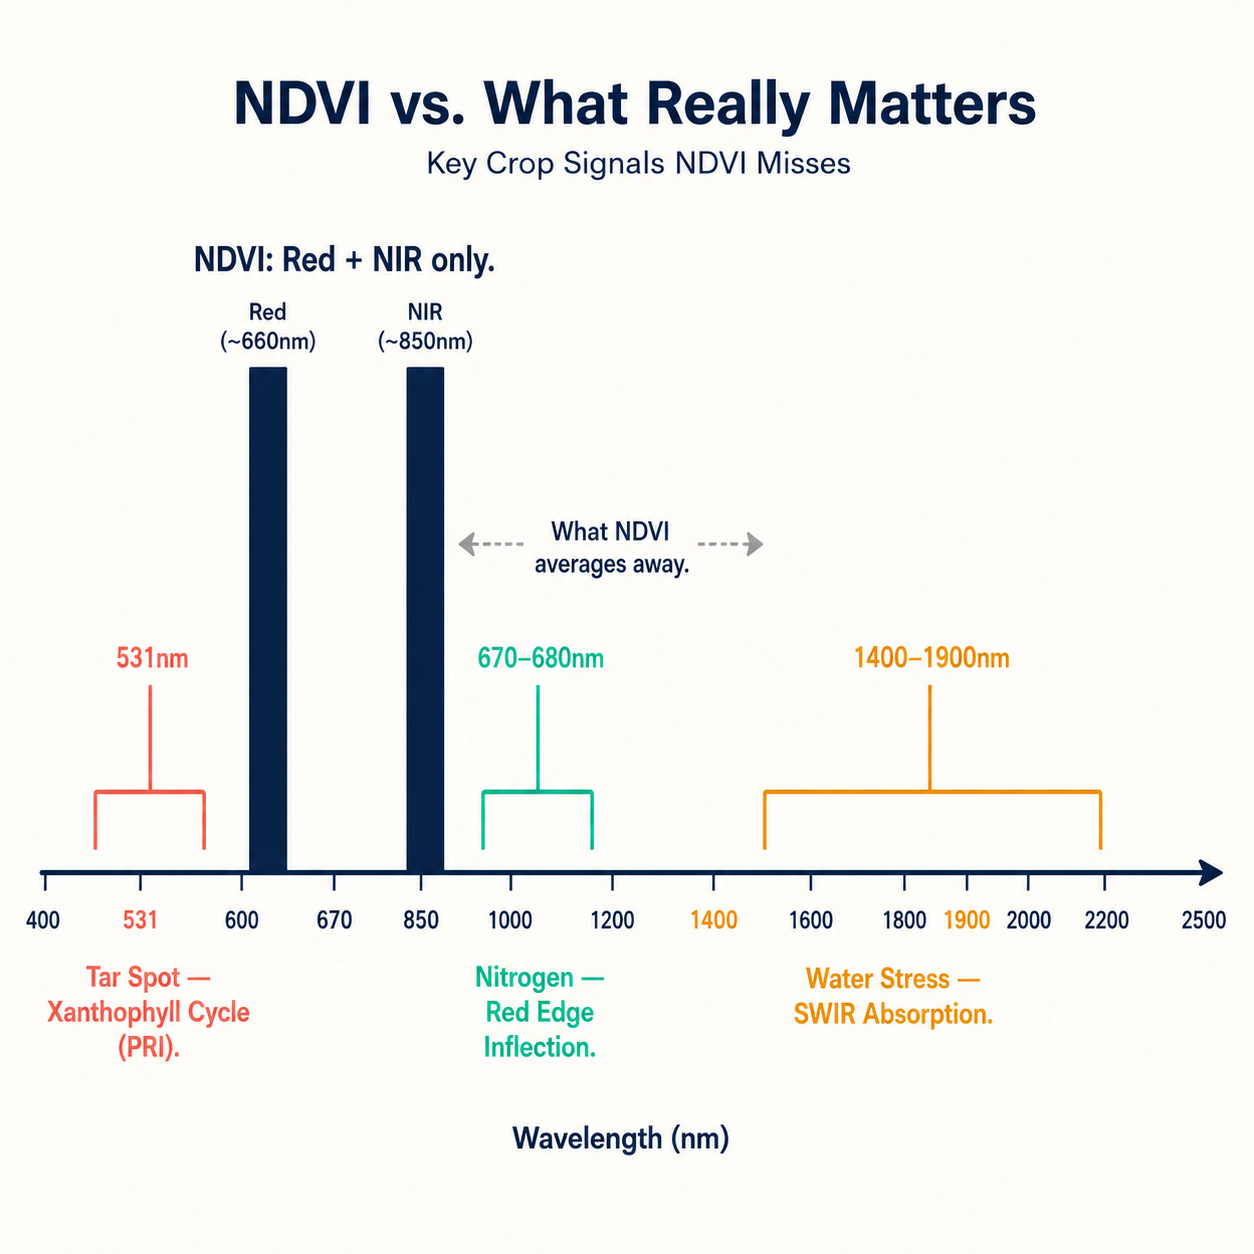
NDVI compresses what's happening across potentially 135 diagnostic spectral bands into two broadband values: red and NIR. The result tells you that a canopy is stressed. It can't distinguish nitrogen deficiency from water stress from early tar spot infection because the respective spectral signatures — chlorophyll absorption shifts in the 670–680nm red edge, SWIR band flattening at 1400–1900nm, xanthophyll cycle response at 531nm — are precisely what NDVI averages away. In a 200-hectare corn block, those three causes have three different prescriptions: urea application, targeted irrigation, or a pre-R3 fungicide pass. Applying nitrogen to a water-stressed field wastes $15–25 per acre and delays any correct response. US corn disease losses in 2024 totaled 963 million bushels — tar spot alone accounted for 280 million. The monitoring flagged all of it as stressed. The diagnosis of what to do with that information wasn't there.
The question I now ask in every vendor evaluation meeting: does the platform distinguish what kind of stressed, or does it just tell you stressed?
When I Mapped the Options, Everyone Stopped at the Same Point
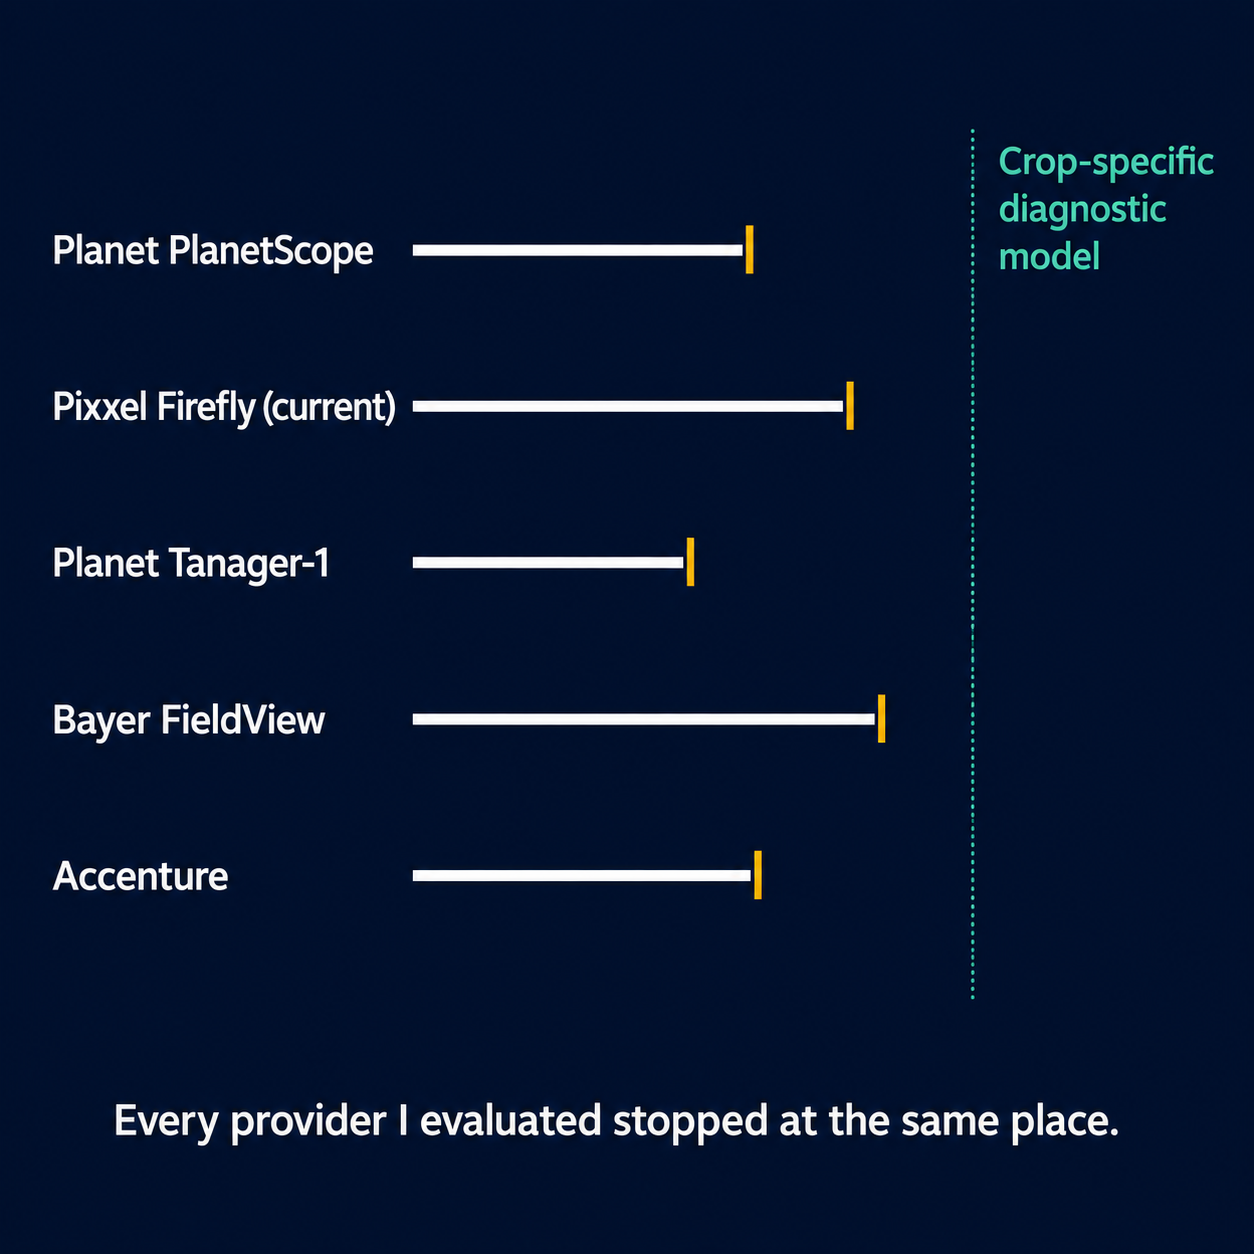
My team spent real time evaluating what a grower considering hyperspectral data would actually encounter. The satellite side has moved quickly. Pixxel launched six Firefly satellites in 2025, delivering 135 bands at 5.4-meter resolution via UP42 and SkyFi. Planet's Tanager-1, commercially available September 2025, covers 400–2500nm — the full VNIR-plus-SWIR range. Genuinely impressive sensor infrastructure.
The call that crystallized the limit was with a client who had already purchased Pixxel access and expected us to deliver water stress diagnosis from it. I had to explain that Firefly's current bands — 470–900nm — don't include the SWIR range where water absorption features are most diagnostic. Pixxel's Honeybee Zero constellation (planned 2026) will add full SWIR coverage. Until then, any water stress detection workflow using Pixxel data has to be supplemented with Planet Tanager-1 or drone-mounted SWIR sensors. The client had evaluated satellite vendors based on what the brochure said, not on which specific diagnostic problems the spectral range actually covered. That's a conversation I've had more than once.
What I track as I map the landscape: Bayer's Climate FieldView at 150 million-plus subscribed acres ingests third-party imagery without performing spectral analysis. John Deere's Operations Center API accepts prescription maps; it doesn't generate them. Accenture acquired a majority stake in a European precision agriculture analytics firm in February 2025, expanding their advisory practice in the space. I follow all of these because my clients evaluate all of them — and knowing exactly where each one stops is the only way to have an honest conversation about what actually has to be built.
The Part Nobody Talked About: Ground Truth Is Consulting Work
My original framing of the hard part was model architecture. 3D-CNNs operating across both spatial and spectral dimensions — rather than the 2D image processing that loses spectral correlation across adjacent pixels — are what make it possible to distinguish the xanthophyll shift at 531nm from the SWIR water-stress signature before either becomes visible to a camera or NDVI. That architectural choice is real, and it determines whether the output is a stress map or a usable diagnosis.
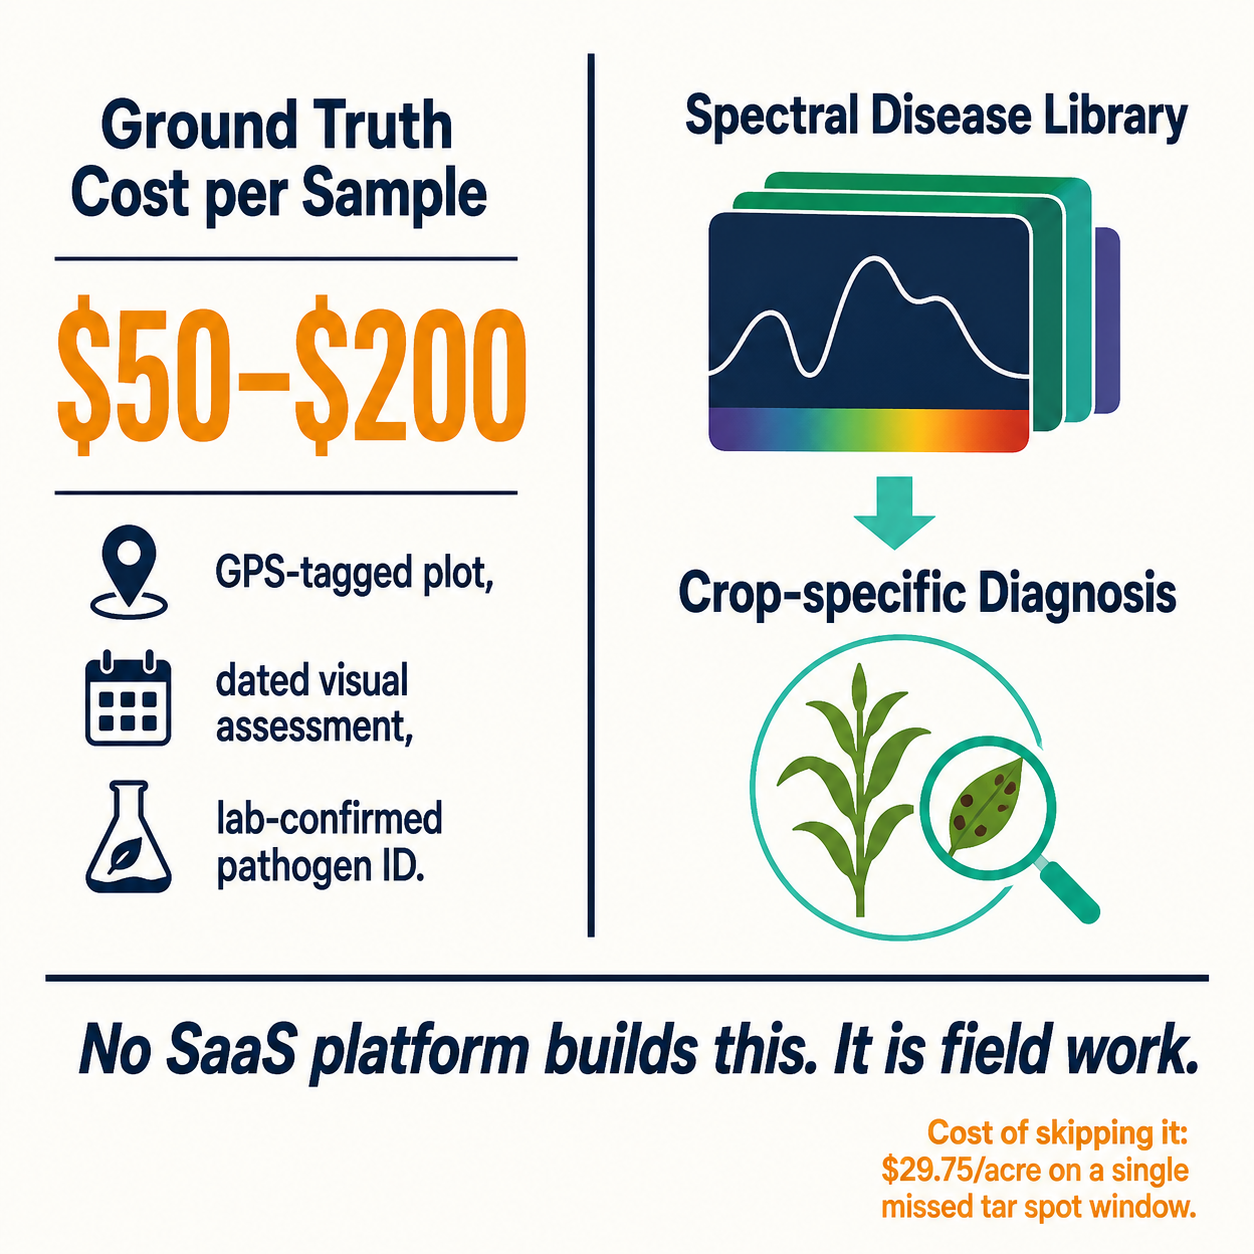
Then I got the first ground-truth collection bid for a corn operation: $50–$200 per GPS-tagged field sample, with dated visual assessments and lab-confirmed pathogen identification per sample. A spectral disease library meaningful enough to distinguish stress types on a specific crop variety in a specific geography requires enough samples to cover the relevant pathogens, growth stages, and hybrid responses. No satellite platform and no FMP has built these libraries for specific crop-geography-hybrid combinations, because that's expensive field work — not a SaaS feature. A model trained on generic corn disease signatures performs materially differently than one calibrated to your hybrids under your local conditions. There is no shortcut to the ground truth, and that single realization rearranged how I think about the competitive landscape. Accenture does advisory and systems integration. Pixxel and Planet sell data access. The library for your fields, trained on your pathogens, calibrated to your hybrids — that's the consulting work that doesn't come with any of those subscriptions.
Why R3 Made All of This Urgent
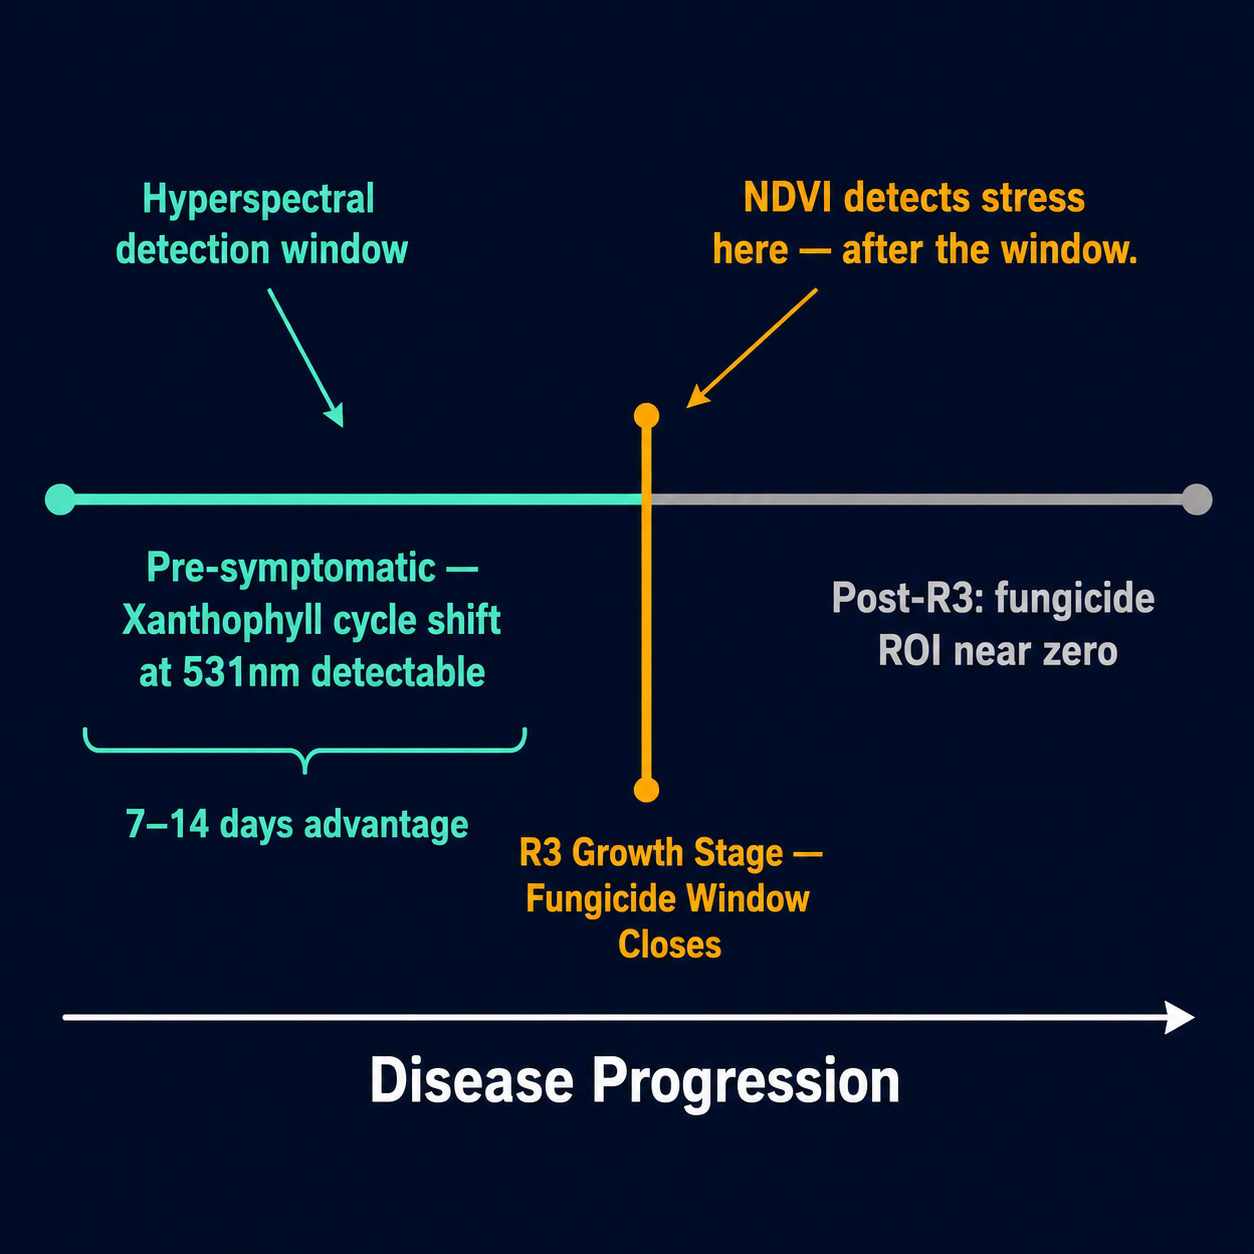
The fungicide-timing constraint is the first thing I explain now when I describe what the detection window actually means. Iowa State pathology data is clear: fungicide application after the R3 corn growth stage delivers near-zero ROI against tar spot. The xanthophyll cycle response at 531nm — the earliest detectable signal of tar spot infection — appears measurably 10–14 days before lesions become macroscopically visible at R3–R4. Hyperspectral deep learning catches that shift. Standard multispectral monitoring doesn't. That 7–14-day pre-symptomatic advantage is real and meaningful — but only if the diagnosis is correct and the prescription reaches the equipment before R3.
That chain — correct diagnosis, right prescription, equipment integration, timing — is why I describe what my team builds at Veriprajna as a pipeline rather than a model. A 3D-CNN that correctly identifies tar spot in field zone 7 still has to generate a VRT prescription map the applicator at the field boundary can read: boom width, nozzle spacing, minimum application rate, geospatial format the FMP API accepts. For EU clients, this has become explicit — from January 2026, Farm to Fork regulations mandate electronic spray records with geospatial data updated within 30 days, with IPM certification required for applications. That compliance output has to come out of the same pipeline, not as a separate manual step my client's agronomist manages after the fact.
When I run the economics with clients, I start with the California vineyard data: hyperspectral monitoring combined with AI-derived prescriptions reduced fungicide use 22% while maintaining yield quality. At Napa Valley grape valuations, that math is obvious before a single spray decision is improved. For row-crop clients, I use the USDA ERS estimate — 3.7–3.9% in production cost savings per acre from precision agriculture practices — alongside research putting ROI above 150% in cases where the right diagnosis drove timely fungicide application. The break-even threshold looked different before 963 million bushels of corn disease losses in a single season.
The Question I'm Still Working Through
Every buyer conversation I've had in the past year has started with a story about a previous vendor. Agtech VC fell 25.6% in 2024. At least 28 vertical farming companies folded. The distrust is earned, and I don't argue with it — the pattern of "spectral AI" promises delivering NDVI-with-branding is real and recent.
What I find more interesting is where the distrust has started to soften. Not from better marketing or more demos — from buyers who have started asking the specific questions: what does your ground-truth collection methodology look like, what VRT prescription format does your output generate, and can you show me the confusion matrix on nitrogen vs. water vs. tar spot for my crop variety. Those are the questions that separate a model from a pipeline. And the operations that are asking them are usually the ones that have already been burned once by a platform that answered the easy question — "does your system detect stress?" — and left the hard question unasked.
I don't think the precision agriculture analytics problem is solved, even where the technology works well. The build-vs-buy line for a crop-specific spectral pipeline looks genuinely different at every farm size and every crop combination. What I'm still figuring out is how to make the ground-truth investment phase legible before the season starts, not after the fungicide window has closed.