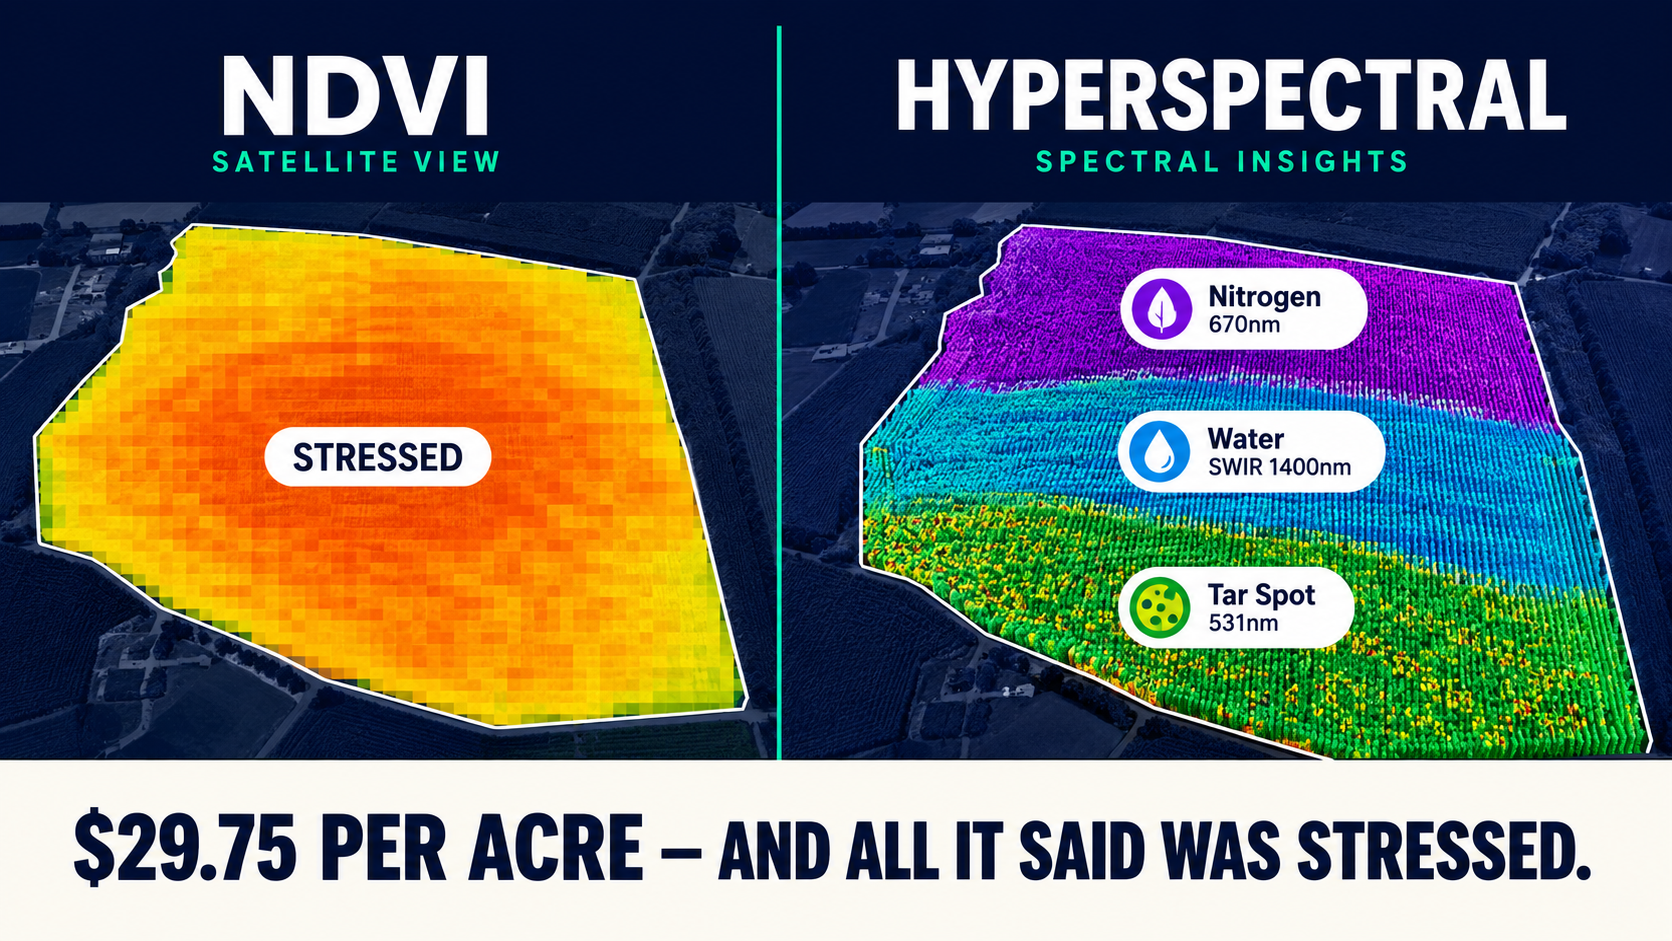
Applying nitrogen to a water-stressed field wastes $15–25 per acre. Missing a tar spot fungicide window past the R3 corn growth stage costs up to $29.75 per acre in a bad Illinois season. Both outcomes share the same failure point: a stress alert that couldn't distinguish between two different prescriptions. In 2024, US corn disease losses reached 963 million bushels — 6% of the national yield — and the diagnostic technology to prevent a meaningful share of that was already available. The gap isn't the sensor. It's the analytics layer between raw spectral data and an actionable field prescription.
When the Amber Alert Doesn't Tell You Anything Actionable
Planet's PlanetScope delivers daily global coverage at 8 bands and 3-meter resolution for roughly $0.85 per acre per year. Sentinel-2 delivers 13 bands for free. Both compute NDVI reliably and flag canopy stress at field scale. What neither can do is tell you whether the northeast quarter of your 200-hectare corn block needs nitrogen, irrigation, or a fungicide pass — because that distinction lives in spectral information they've averaged away.
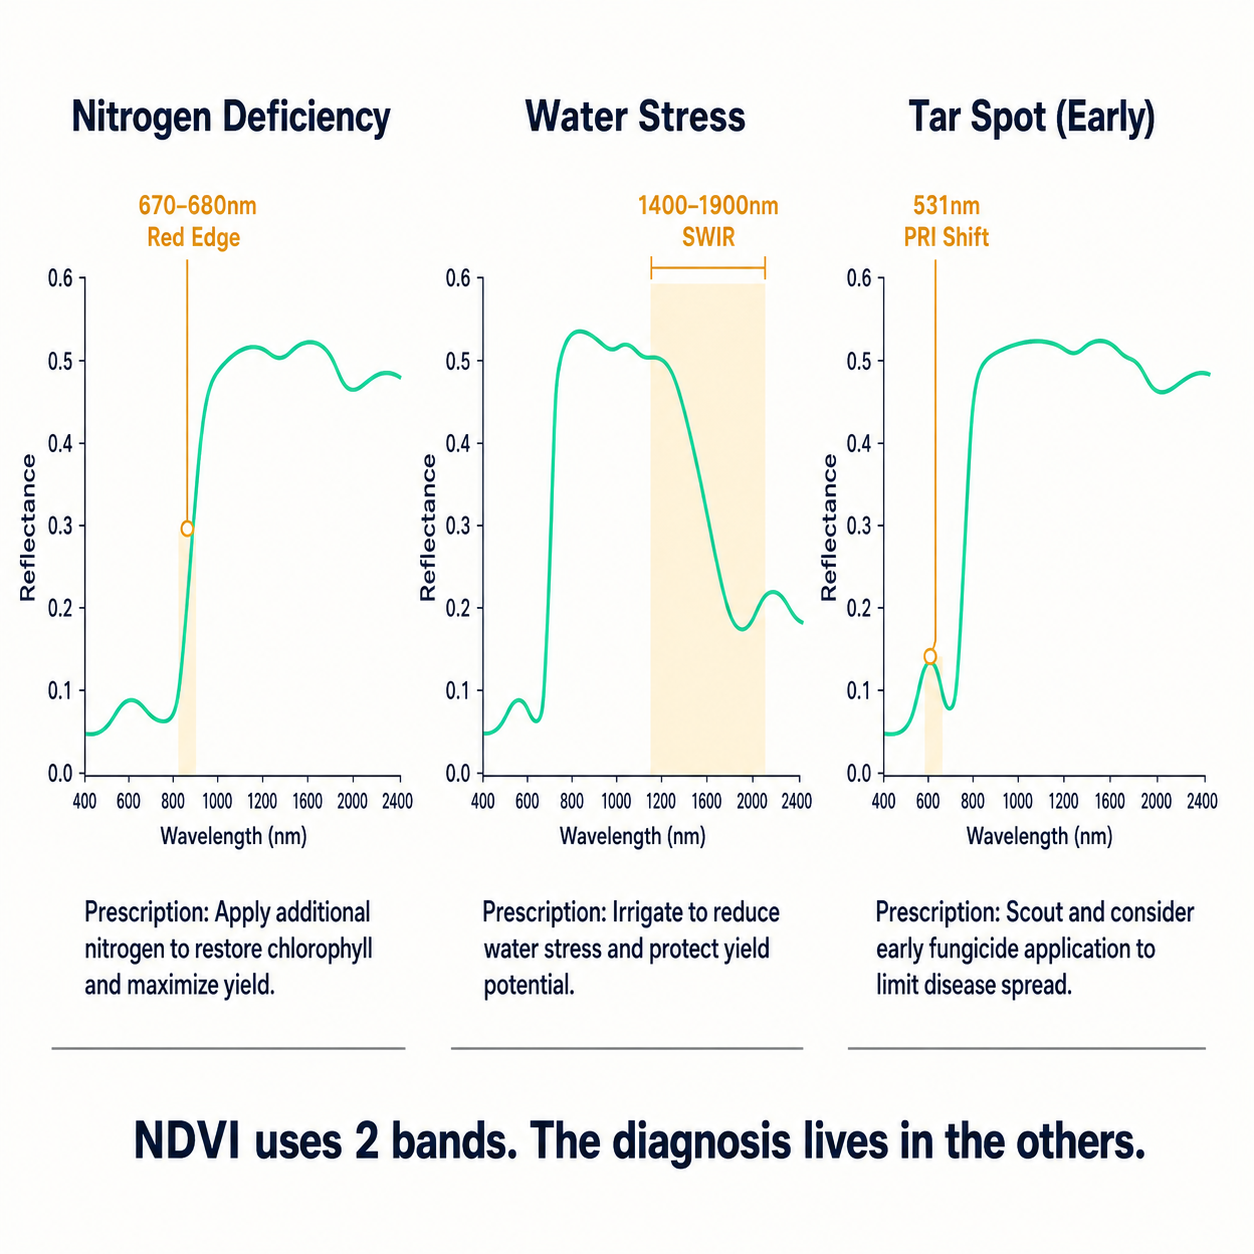
Nitrogen deficiency concentrates in the 670–680nm visible range and the red edge: chlorophyll absorption drops, the Red Edge Inflection Point shifts 3–5nm toward blue. Water stress is a different spectral story — stomatal closure affects the SWIR bands (1400–1900nm) where water absorption features flatten, while visible bands show minimal change until the stress is severe. Early tar spot — Phyllachora maydis — triggers a xanthophyll cycle response at 531nm that's measurable weeks before macroscopic lesions form at R3–R4. NDVI compresses all three into two broadband values and returns: "stressed."
The wrong response to an ambiguous alert is often worse than no response at all.
This isn't rhetorical. Applying nitrogen to a water-stressed field doesn't fix the stress, runs up input cost, and often delays the right intervention past the point where it matters. Applying fungicide after R3 delivers near-zero ROI per Iowa State pathology data. The 963 million bushels of US corn disease losses in 2024 — tar spot alone accounting for 280 million of them — aren't simply a monitoring failure. They're a diagnosis failure at scale.
The Provider Map: Where Each One Stops
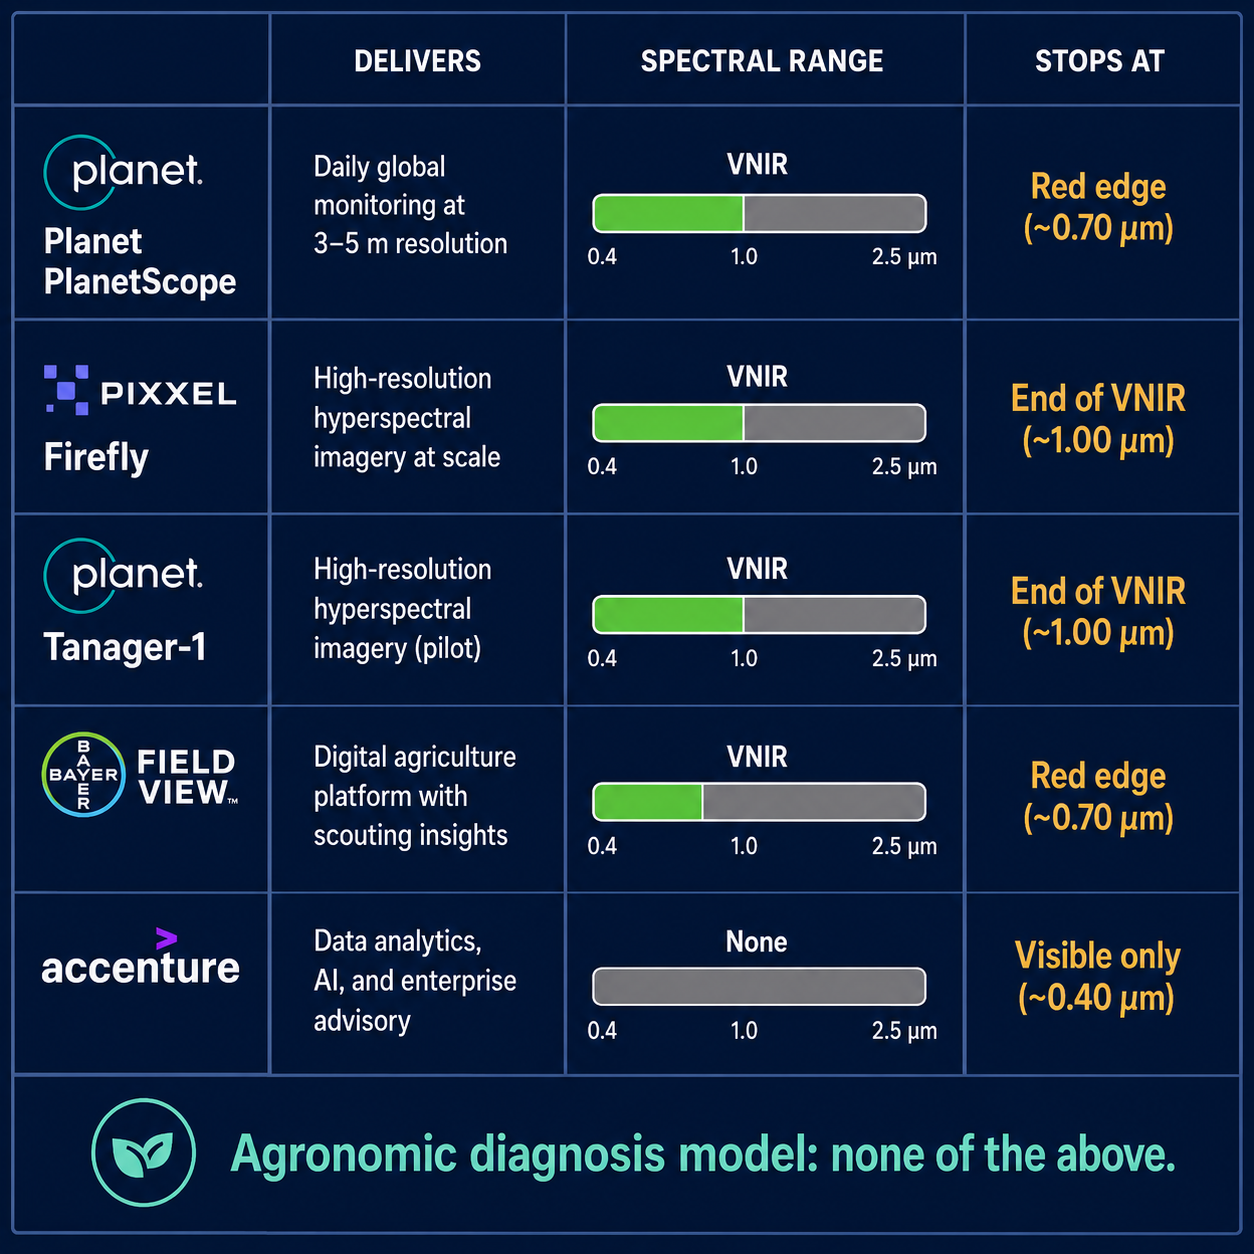
Pixxel launched six Firefly satellites in 2025, delivering 135 bands from 470–900nm at 5.4-meter ground resolution, available via UP42 and SkyFi. The VNIR coverage matters for chlorophyll, red-edge, and canopy chemistry diagnostics. What Firefly currently lacks is SWIR coverage — the 1400–1900nm range where water stress is most clearly readable. Pixxel's Honeybee Zero constellation (planned 2026) will add that capability. For operations that need water stress detection before HB0 launches, Planet's Tanager-1 satellite (400–2500nm, commercially available September 2025) covers the full VNIR-plus-SWIR range, though its modeled use cases are built for methane and carbon monitoring, not crop stress diagnosis.
Neither satellite provider has built the agronomic models. Both sell data access.
Bayer's Climate FieldView platform serves 150 million-plus acres with 60-plus integration partners. It executes prescriptions well and ingests third-party imagery without performing spectral analysis. John Deere's Operations Center API documents the pathway to VRT equipment integration — but the API receives prescription maps, it doesn't generate them. Accenture acquired a majority stake in a European agri-digital analytics firm in February 2025, expanding its precision agriculture advisory practice; the firms implementing those engagements still reach for commercial platforms rather than custom spectral pipeline engineering.
The sensor and platform market has matured significantly. The diagnostic gap has not.
What Gets Built Where the Platforms Stop
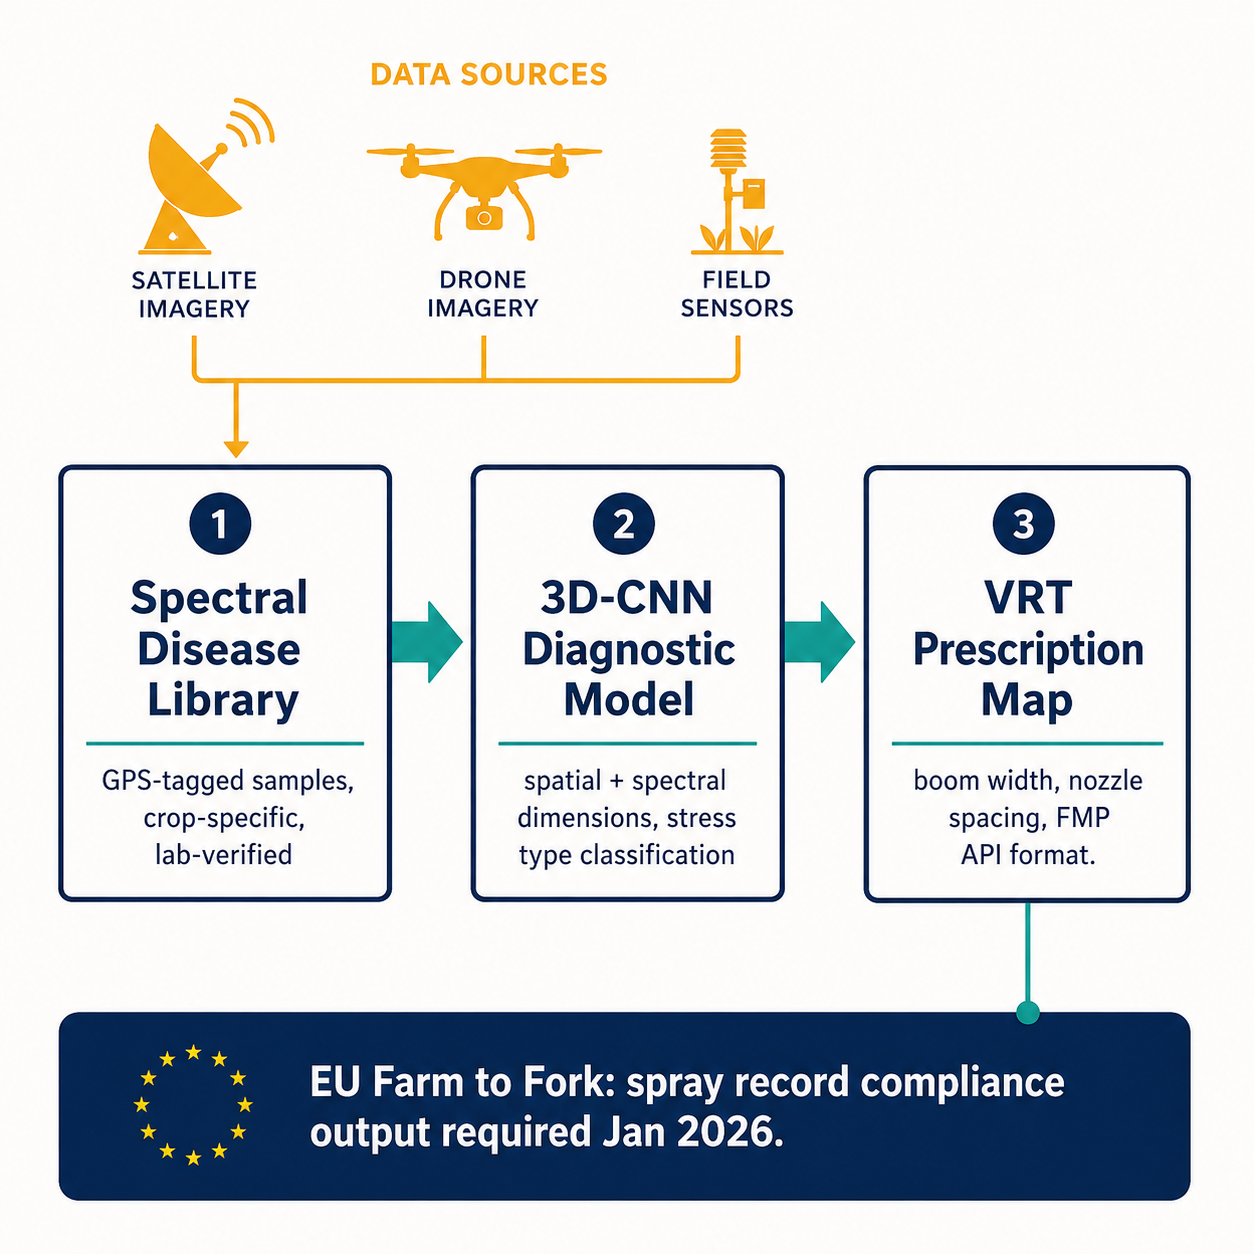
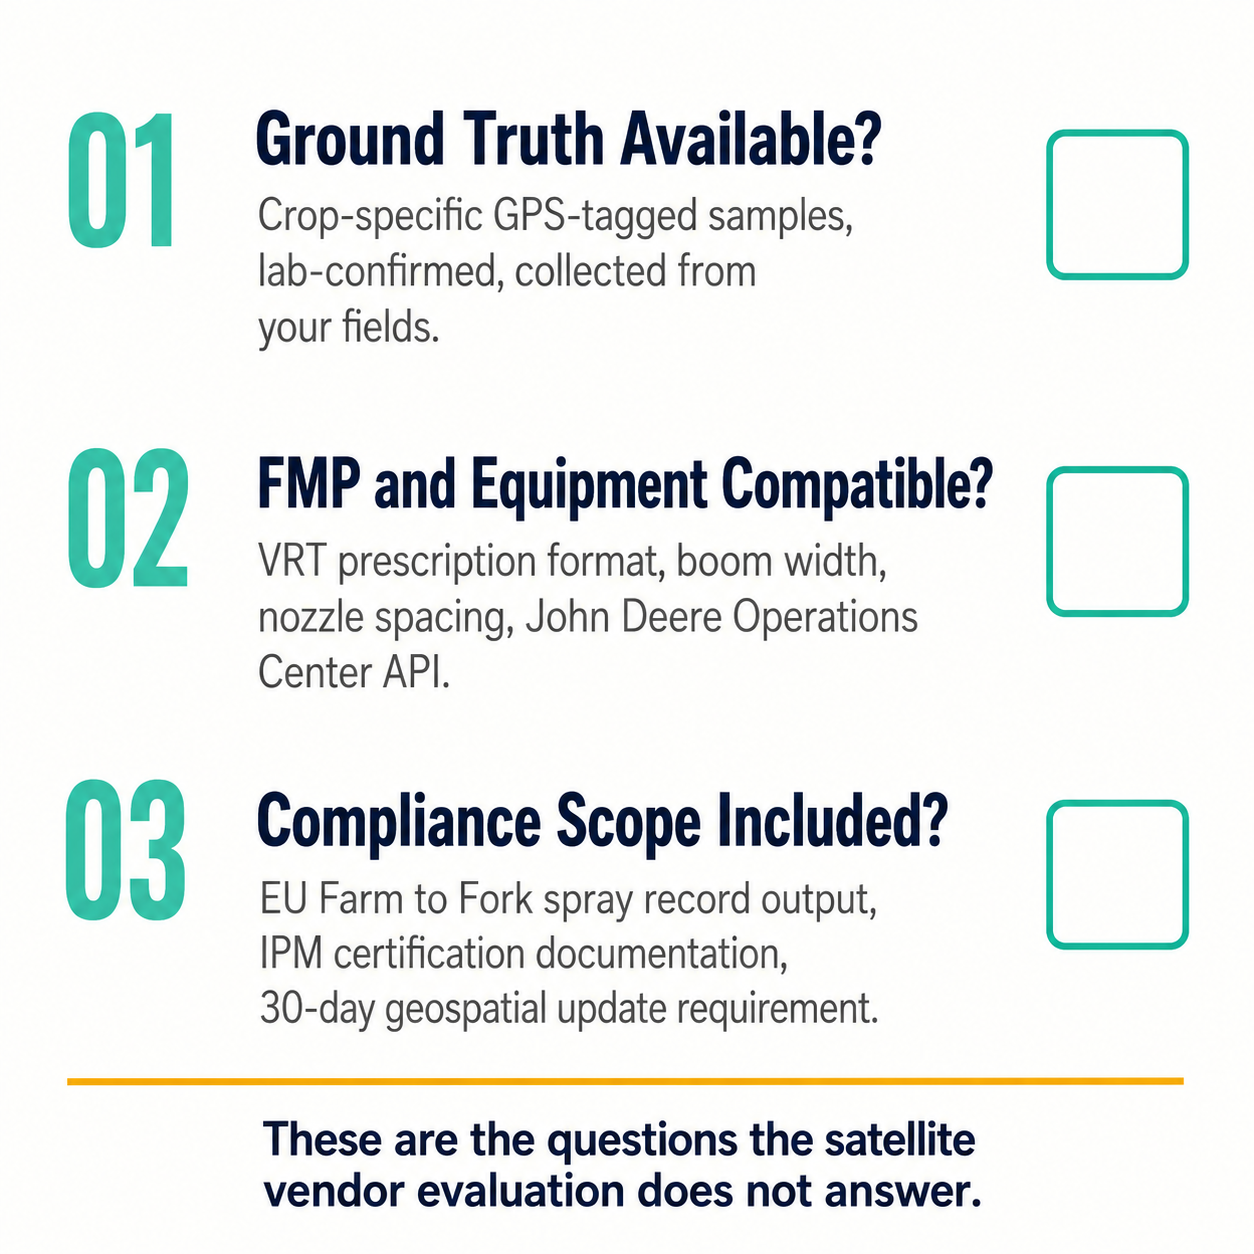
Ground truth is where the diagnostic pipeline actually breaks down for most operations. Training a spectral disease model for a specific crop variety requires GPS-tagged field plots, dated visual assessments, and lab-confirmed pathogen identification — roughly $50–$200 per sample. No commercial satellite or FMP provider has built these libraries for specific crop-geography-hybrid combinations, because it's expensive consulting work, not a SaaS feature. Without a library built from your fields, a model trained on generic corn disease signatures will perform materially differently than one calibrated to your hybrids under your local climate conditions.
Once that library exists, model architecture matters more than the data source. Standard CNNs process spectral data as 2D images, losing the spectral correlation structure across adjacent pixels. 3D-CNNs and spectral transformers operate across both spatial and spectral dimensions simultaneously — which is what makes it possible to distinguish the 531nm xanthophyll shift from the SWIR water-stress signature before either becomes visible to a camera or NDVI. That architecture choice determines whether the output is a stress map or a usable diagnosis.
Solving the model problem surfaces the next constraint: prescription execution. A hyperspectral model that correctly identifies tar spot in field zone 7 still has to generate a VRT prescription map that the equipment at the field boundary can read — respecting boom width, nozzle spacing, and minimum application rate constraints that vary by applicator. From January 2026, EU Farm to Fork regulations require electronic spray records with geospatial data updated within 30 days, with IPM certification required for spray applications. That compliance output has to write to formats the FMP APIs actually accept, or the diagnosis never converts to action.
This is the pipeline our team builds at Veriprajna: sensor-agnostic spectral analytics — the same architecture runs over Pixxel VNIR data, Planet Tanager-1 SWIR data, or drone-mounted Headwall imagery — wired into VRT prescription outputs and FMP integrations for the operation's existing equipment.
When the Economics Become Unavoidable
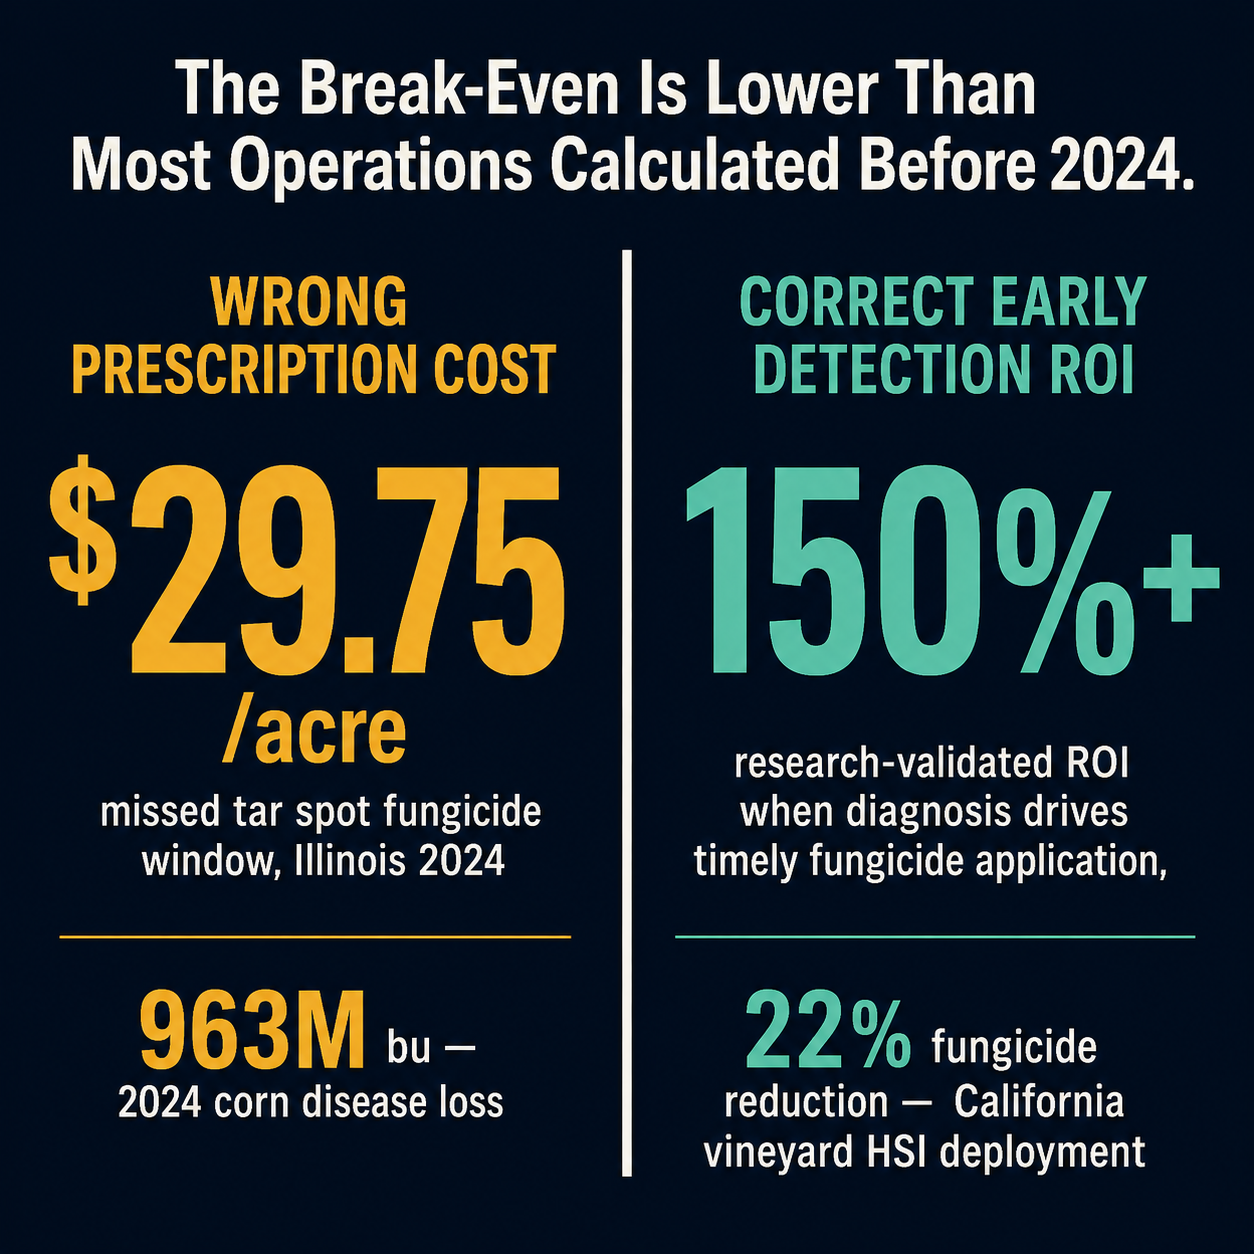
High-value crops showed the arithmetic first. In California vineyards, hyperspectral monitoring combined with AI-derived prescriptions reduced fungicide use by 22% while maintaining yield quality — and at Napa Valley grape valuations, a premium analytics cost justifies itself before a single spray decision is improved. Row-crop margins compress the math differently, but the USDA ERS puts precision agriculture savings at 3.7–3.9% of production cost per acre on US corn, and 963 million bushels of disease losses in a single season suggests the break-even threshold is lower than most operations had calculated before 2024.
Variable-rate nitrogen application delivers meaningful fertilizer savings while maintaining yields. In wheat, VRT improved per-hectare gains by 7.2% (roughly 164 EUR per hectare) over uniform application. Research on early hyperspectral disease detection puts ROI above 150% in cases where the diagnosis drove timely fungicide application — and the fungicide-timing constraint is the reason detection latency matters so much. The window closes at R3. By the time a multispectral stress alert fires post-symptom, the intervention window on tar spot has often already closed.
Seven to fourteen days of pre-symptomatic detection advantage over standard multispectral monitoring means the intervention decision gets made before the economic damage is locked in — but only if the model can distinguish what it's actually seeing.
The Due Diligence Question That Changes the Conversation
Agtech VC fell 25.6% in 2024. At least 28 vertical farming companies declared bankruptcy or ceased operations by the end of that year. The cohort of buyers that emerged from that period has been promised spectral diagnosis and delivered stress maps with better branding. The due diligence question for any operation evaluating hyperspectral monitoring now isn't which satellite constellation to buy access to — it's who builds the spectral model between the data and the prescription, and what does that model require to be accurate for your crops and your conditions.
In our experience, that question surfaces three inflection points: whether the operation has crop-specific ground-truth data (or the budget and timeline to collect it), whether existing FMP and equipment can execute the VRT output the model generates, and whether regulatory compliance output is inside or outside the analytics scope. Most operations evaluating satellite data subscriptions have answered the first two questions for the satellite vendor, not for the analytics layer.
If you're working through how those three questions land for your operation, we'd be genuinely interested to hear where the analysis is pointing — the build-vs-buy line in precision agriculture looks different at every farm size and crop combination, and the inflection point varies enough that a short conversation is usually more useful than a decision framework built in the abstract. We've laid out the ground-truth requirements, model architecture specifics, and FMP integration scope at veriprajna.com/solutions/hyperspectral-agriculture-ai — worth a look before the satellite data subscription conversation starts.