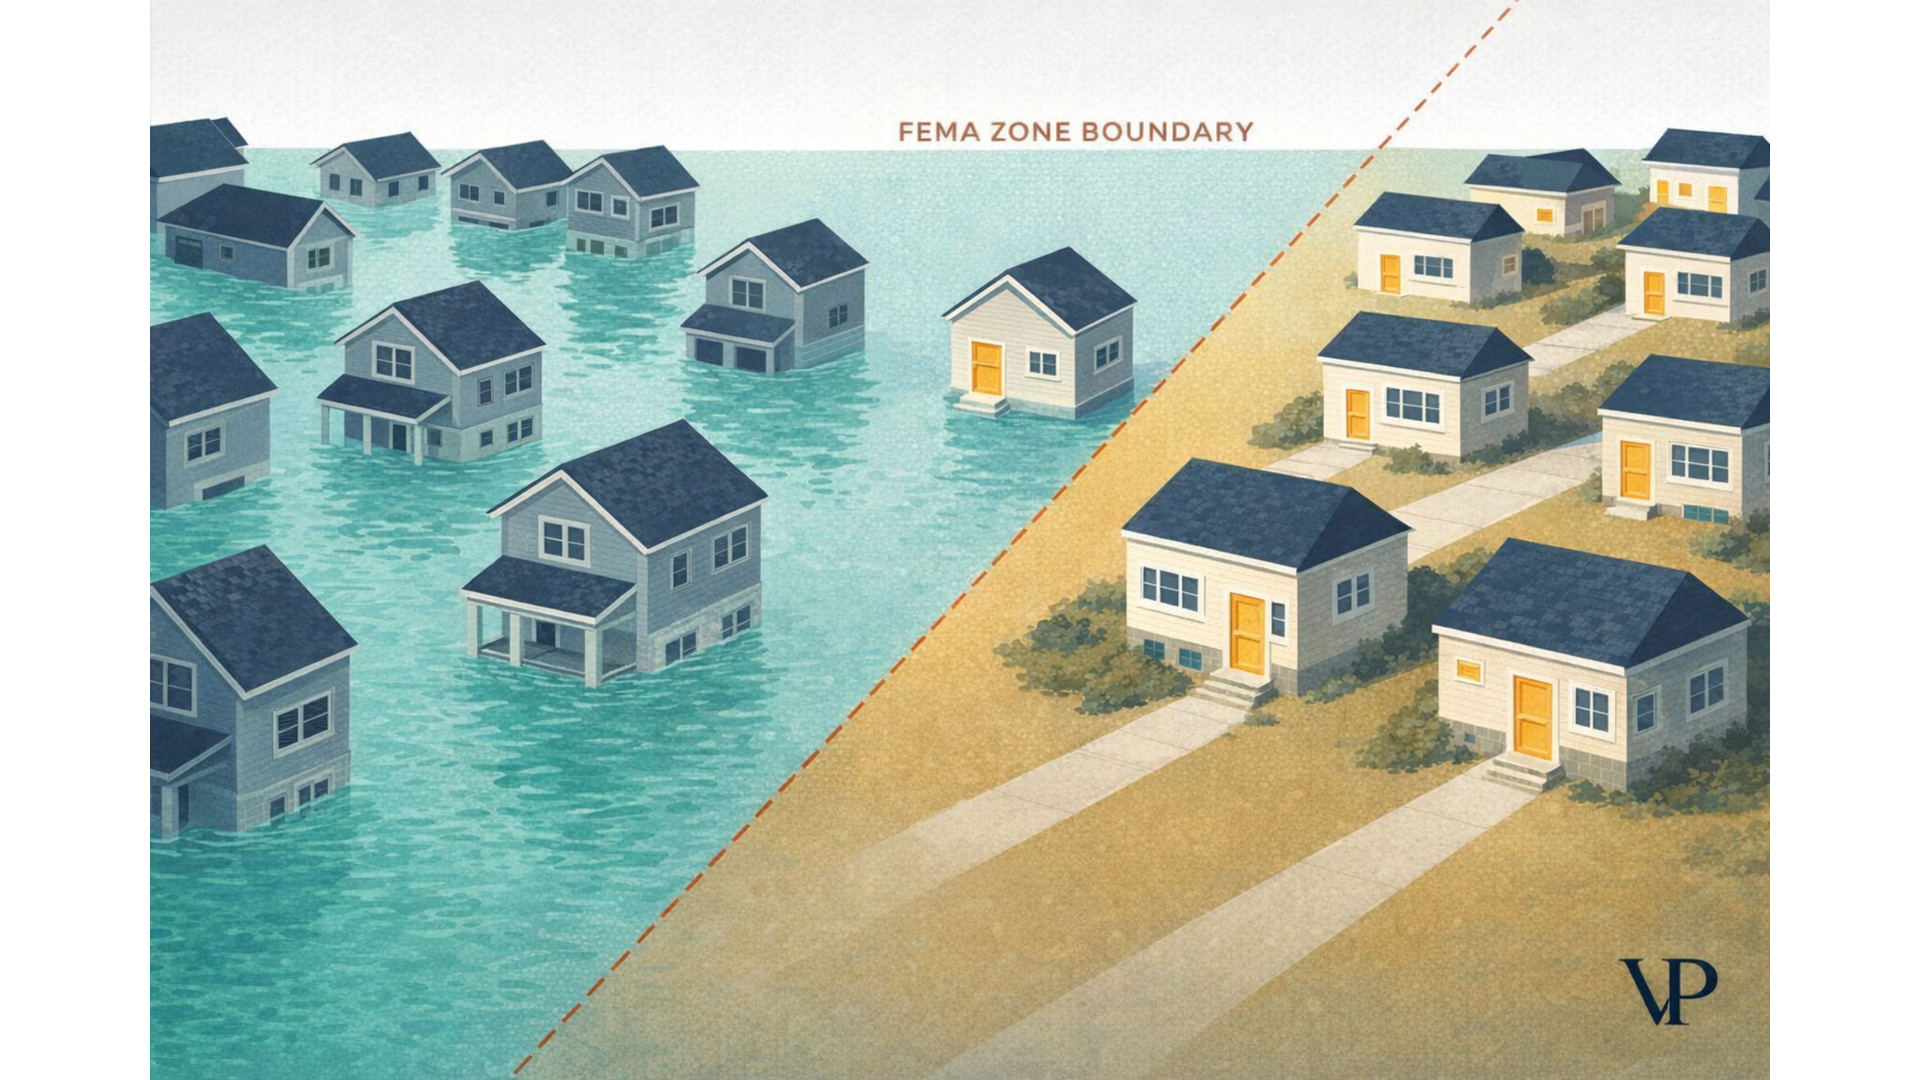
Nearly 68% of flood damage in the United States occurs outside of areas FEMA designates as high-risk. That means the maps insurers rely on to price your flood policy — maps that are, in many cases, decades old — are missing most of the problem. The result is a flood risk underwriting system where millions of properties are overcharged, millions more are dangerously underinsured, and insurers are hemorrhaging money on losses they never saw coming.
We've spent the past year studying how a convergence of three AI technologies — computer vision, satellite radar, and physics-informed neural networks — is replacing this broken system with something fundamentally different: pixel-level flood risk assessment that evaluates every building individually, updates in near real-time, and simulates future storms rather than relying on historical averages. The shift isn't incremental. It's architectural.
The Map Problem Is Worse Than You Think
Roughly 75% of FEMA flood maps are more than five years old. About 11% date back to the 1970s and 1980s. These maps were drawn for a world with different rainfall patterns, different urban density, and far less concrete.
The damage they cause is subtle but devastating. FEMA maps create what underwriters call a "cliff effect" — a binary line where one side of the street is labeled high-risk and the other is labeled safe, even though water doesn't respect property lines. A home one foot inside a Special Flood Hazard Area pays thousands in mandatory insurance. Its neighbor one foot outside often carries none.
Less than 4% of American homeowners carry flood insurance — partly because the maps tell them they don't need it.
There's an even bigger blind spot. FEMA maps were designed primarily around rivers overflowing and coastal storm surge. They largely ignore pluvial flooding — the kind caused by intense rainfall overwhelming drainage systems in urban areas. Every new parking lot, every paved-over yard, every aging storm drain increases pluvial risk. But the maps don't see it.
The economic consequence is predictable: insurers using these coarse maps systematically underprice high-risk properties and overprice low-risk ones. Sophisticated buyers exploit the mispricing. Low-risk homeowners opt out. The risk pool deteriorates. The homeowners' insurance combined ratio — the industry's core measure of profitability — hit 110.5% in 2023, meaning insurers paid out $1.10 for every dollar they collected.
We explored this systemic failure in depth in our interactive analysis of Deep AI in flood risk underwriting.
The Single Measurement That Changes Everything
If you could know only one thing about a building's flood vulnerability, it should be this: how high is the lowest floor above the ground?
This measurement — called First Floor Elevation, or FFE — has an almost absurdly outsized impact on flood losses. Research shows that raising a property's first floor by just one foot above the base flood level can reduce average annual losses by approximately 90%. One foot. Ninety percent.
And yet, this number is almost never in the data. Public tax records don't capture it. Getting a professional Elevation Certificate costs hundreds of dollars and requires a surveyor to visit the property. So legacy underwriting models guess — assuming, say, that all homes in a region have a standard one-foot crawlspace. The error margins are enormous.
One foot of elevation can mean the difference between a dry living room and a $34,000 claim.
This is where computer vision enters the picture.
How AI Reads a Building's Flood Risk from a Photo
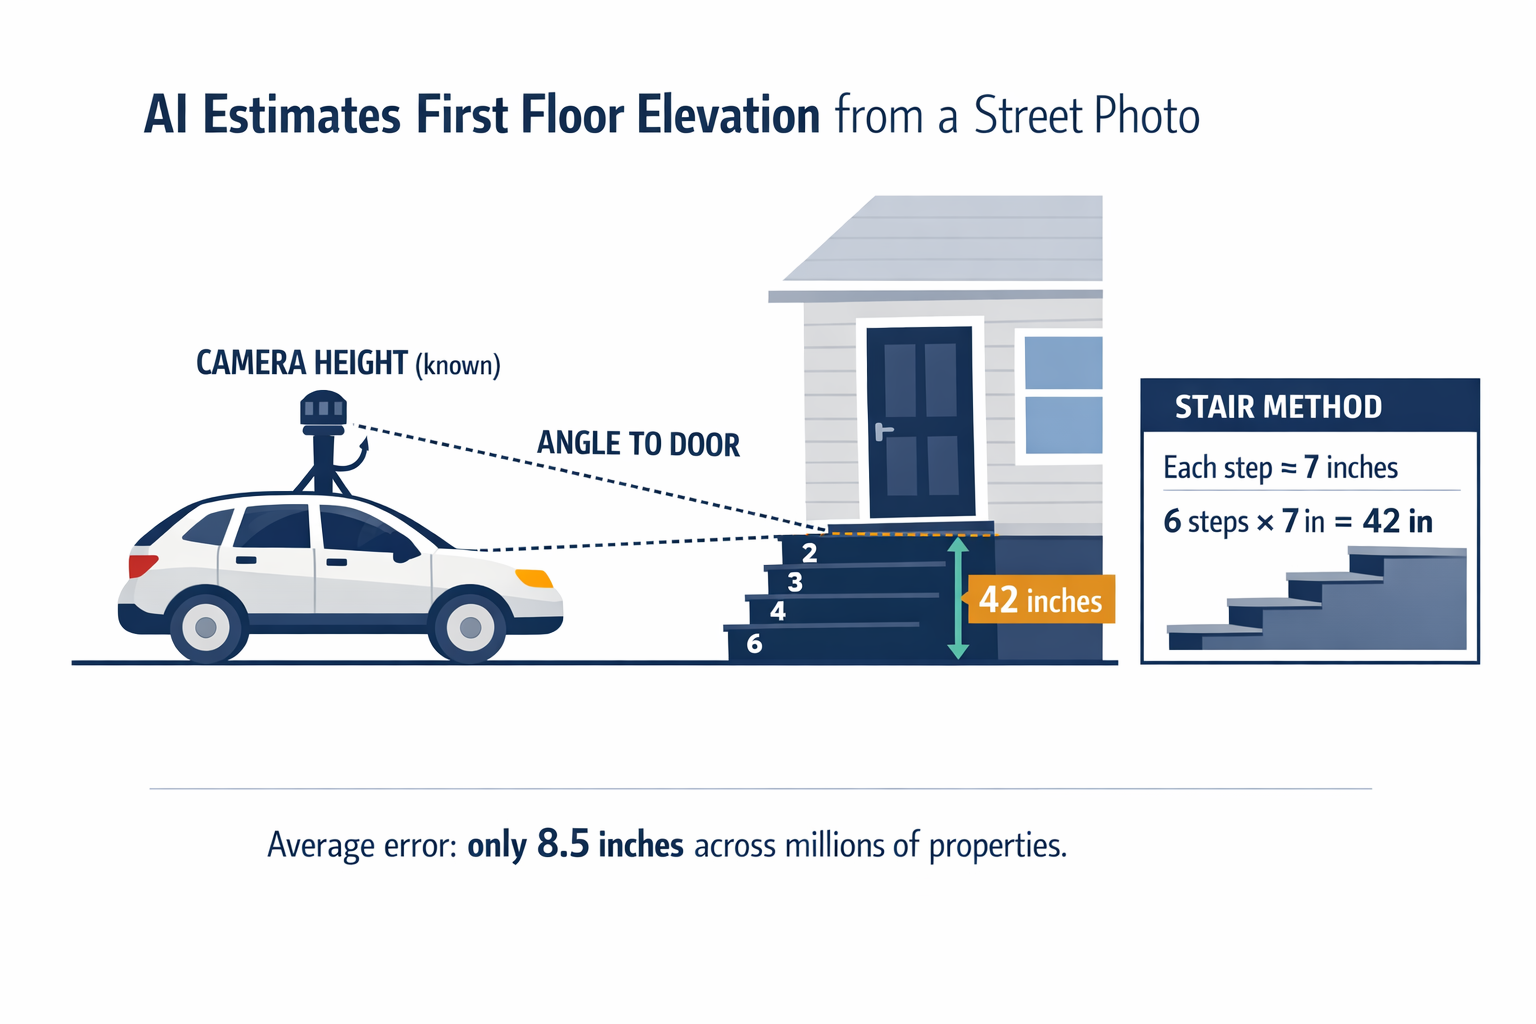
Modern AI systems can estimate First Floor Elevation from a Google Street View image — no site visit required. The process is more clever than complex.
A neural network analyzes the street-level photo and identifies architectural features: the ground line, the foundation, the front door, the stairs. It estimates depth — how far the camera is from the building — using the same visual cues a human brain uses to judge distance in a flat photograph. Then it applies basic geometry: knowing the camera's height on the mapping vehicle and the angle to the door threshold, it calculates the physical height of the entrance above street level.
There's an even simpler backup method. The AI counts the stairs. Building codes specify that each step is roughly 7 inches tall. Six steps means the first floor sits about 42 inches up. Neural networks trained on this approach have achieved average errors of just 0.218 meters — about 8.5 inches.
Scale that across millions of properties and you've replaced an expensive, manual process with something that runs in seconds.
But street-level photos only capture one dimension. Aerial and satellite imagery adds the rest. Computer vision systems analyzing overhead images can now detect:
How much of a property is paved over — concrete and asphalt prevent water absorption, directly increasing local flood risk
Whether basement window wells exist — confirming below-grade living spaces that dramatically increase potential losses
Roof condition as a maintenance signal — a deteriorating roof correlates with deferred maintenance across all building systems, including drainage
Proximity to water bodies and storm drains — with greater accuracy than outdated municipal records
Perhaps most importantly, these systems can spot flood mitigation measures that legacy models ignore entirely: elevated HVAC units, flood vents, raised foundations. An insurer that can see and reward these investments can offer lower premiums to resilient properties — creating a financial incentive for homeowners to protect themselves.
Seeing Through Clouds: Satellite Radar During Active Floods
Computer vision tells you how vulnerable a building is. But during an actual flood, you need to know where the water is — and optical satellites are useless. Floods come with clouds and rain, which block conventional cameras completely.
Synthetic Aperture Radar (SAR) solves this by using microwave pulses instead of light. These pulses pass through clouds, smoke, and heavy rain, then bounce back to the satellite. The physics are elegant: calm water acts like a mirror, deflecting radar energy away from the sensor, so flooded areas appear as dark patches in the image.
Urban flooding is trickier. Radar signals can bounce off floodwater, hit a building wall, and reflect back with high intensity — a phenomenon called "double bounce" that makes flooded streets look dry to simple algorithms. Deep learning models trained specifically on these patterns can now distinguish genuine urban flooding from false signals, a task that stumped traditional approaches.
Commercial SAR constellations like ICEYE can deliver flood extent and depth data within 24 hours of an event's peak. For insurers, this means:
Instant portfolio exposure estimates — overlay the satellite flood map on your book of business and know your losses before the first call comes in.
Targeted adjuster deployment — send people only to properties the satellite confirms were inundated.
A permanent record for fraud detection — if a policyholder claims flood damage but SAR data shows the property was dry, the claim gets flagged immediately.
Combining SAR with optical imagery when skies clear pushes classification accuracy above 92%, even in complex urban landscapes.
Simulating Storms That Haven't Happened Yet
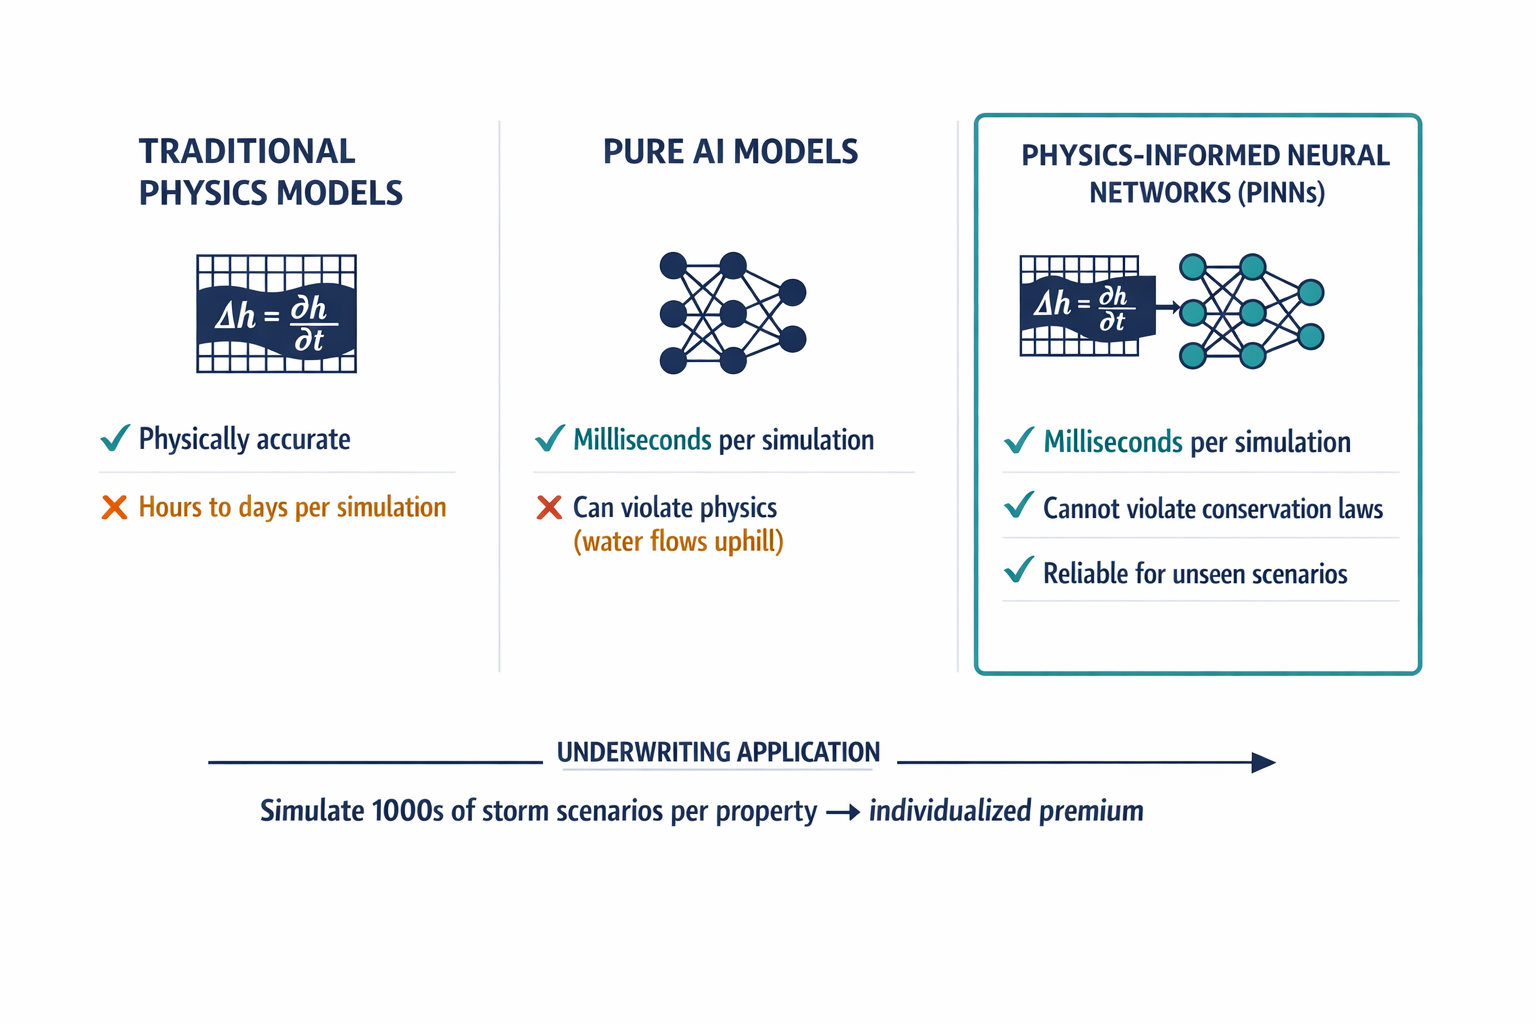
Observational data — photos and radar — describes the present and the past. Underwriting requires pricing the future. Traditional flood simulation models solve the physics equations governing water flow, but they're painfully slow: hours or days to model a single river basin at high resolution.
Pure AI models are fast but unreliable. A neural network trained only on data can produce physically impossible results — water appearing out of nowhere, or flowing uphill.
Physics-Informed Neural Networks (PINNs) split the difference. These hybrid systems embed the actual laws of fluid dynamics — conservation of mass, conservation of momentum — directly into the AI's learning process. The network is penalized not just for getting the wrong answer, but for violating physics.
A PINN can't hallucinate a flood that defies gravity. The physics won't let it.
This constraint makes PINNs remarkably data-efficient and, crucially, reliable in scenarios they've never seen before. A standard AI model trained on Category 3 hurricanes might fail catastrophically when asked about a Category 5. A PINN remains grounded because the underlying physics don't change with storm intensity.
Architectures like HydroGraphNet take this further by modeling watersheds as connected networks — representing how rainfall upstream propagates through rivers, streets, and drainage systems to reach downstream properties hours later. These models can predict water depth across thousands of locations in milliseconds, serving as real-time stand-ins for traditional hydraulic simulations.
For underwriting, this means an insurer can simulate a property's response to thousands of potential storm scenarios — from a routine afternoon downpour to a once-in-500-years hurricane — and generate a premium that reflects the integrated risk across all of them. No more static zone ratings. No more binary in-or-out.
For the full technical methodology behind these simulation approaches, see our detailed research on Deep AI flood risk underwriting.
What This Means for Insurers, Homeowners, and the Market
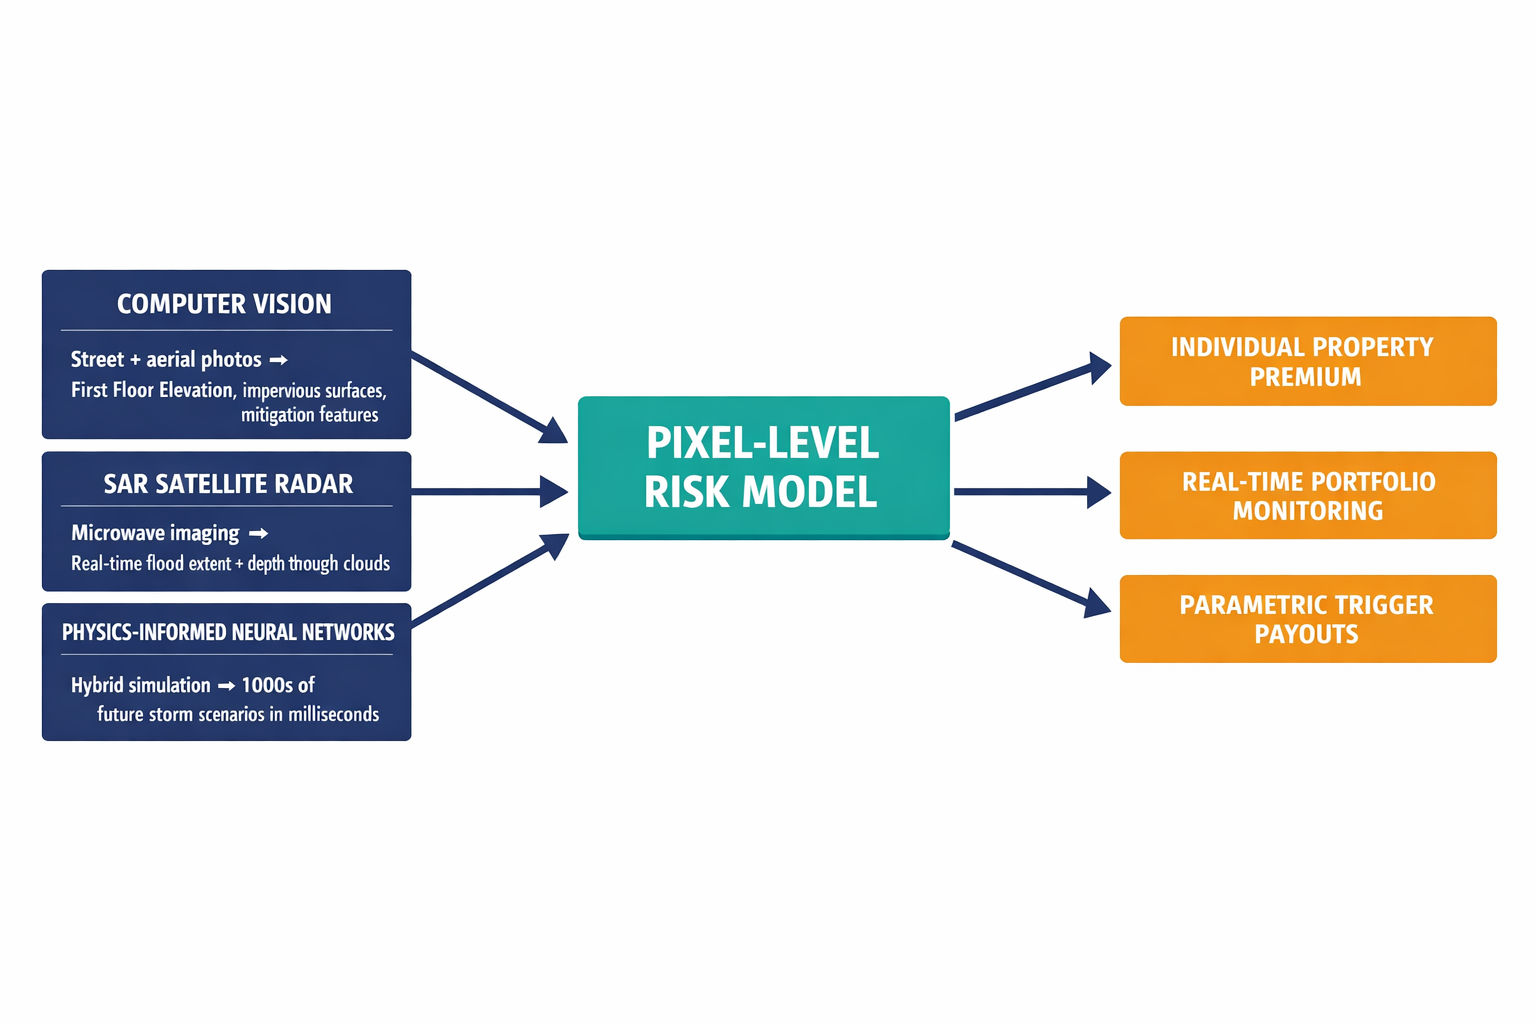
The combined effect of these three technologies — computer vision for structural vulnerability, SAR for real-time hazard monitoring, and PINNs for forward-looking simulation — reshapes flood insurance economics at every level.
For insurers, the immediate prize is finding profitable policies everyone else misses. A home inside a FEMA flood zone with a first floor elevated four feet above the base flood elevation is a good risk that legacy carriers either reject or overprice. A pixel-level model sees it clearly and writes it at a competitive rate. Conversely, a home outside the flood zone sitting in a low-drainage area with an unfinished basement is a bad risk that legacy carriers undercharge. Accurate pricing on both sides stops the bleeding.
For homeowners, granular pricing creates something that doesn't exist today: a financial reward for resilience. Install flood vents, elevate your HVAC, improve your drainage — and your premium should drop. Legacy systems can't see these improvements. AI-driven systems can.
For the market as a whole, this technology enables private flood insurance products that can compete with or supplement the NFIP, and it makes parametric insurance viable at scale. In a parametric model, a payout triggers automatically when satellite data confirms flood depth exceeds a threshold at the property's coordinates — no adjusters, no weeks of waiting, no disputes.
The insurer that can see every building individually will outprice the one still averaging across zip codes. Every time.
Reinsurers — the companies that insure the insurers — are already demanding this kind of transparency. A portfolio underwritten with verified elevation data and monitored via satellite represents a fundamentally higher-quality risk pool, which translates to better reinsurance terms and lower capital reserve requirements.
What About Regulatory Risk and AI Bias?
Fair question. As AI moves closer to the pricing decision, regulators will scrutinize whether models discriminate or produce unexplainable outcomes. This is where physics-informed approaches carry a structural advantage over black-box AI. Because PINNs are grounded in explicit physical equations — water flows downhill, mass is conserved — their outputs are interpretable. An insurer can demonstrate to a state insurance department that a premium increase reflects a measurable hydraulic risk, not an opaque algorithmic correlation.
There's also a legitimate concern about the transition period: what happens to homeowners who discover their "safe" property is actually high-risk? The honest answer is that the risk was always there — the old maps just hid it. Accurate pricing, paired with mitigation incentives, gives homeowners actionable information and a path to lower premiums. The alternative — continuing to underprice known risk — leads to insurer insolvency and coverage withdrawal, which helps no one.
The Static Renewal Is Dying
One final shift worth noting. The traditional insurance model — assess risk at binding, reassess at annual renewal — is becoming obsolete. If a SAR satellite detects land subsidence in a neighborhood, or a neighbor paves over a permeable lawn and alters local drainage, the risk profile of surrounding properties changes immediately. AI-enabled underwriting systems can update continuously, adjusting mid-term rather than waiting twelve months to catch up with reality.
This transforms the insurer's role. Instead of passively paying claims after disaster strikes, a carrier with real-time risk visibility can proactively alert policyholders to emerging threats and recommend specific mitigation steps. The insurer becomes a partner in resilience rather than just a check-writer.
The era of pricing flood risk from paper maps and zip code averages is ending — not because regulators demanded it, but because the math stopped working. The carriers that adopt pixel-level precision will write better business, hold less capital in reserve, and survive climate volatility. The ones that don't will find themselves holding exactly the risks nobody else wanted.
If your organization is navigating this transition — whether on the carrier, reinsurance, or mortgage side — we'd welcome the conversation about what we're seeing in the data.