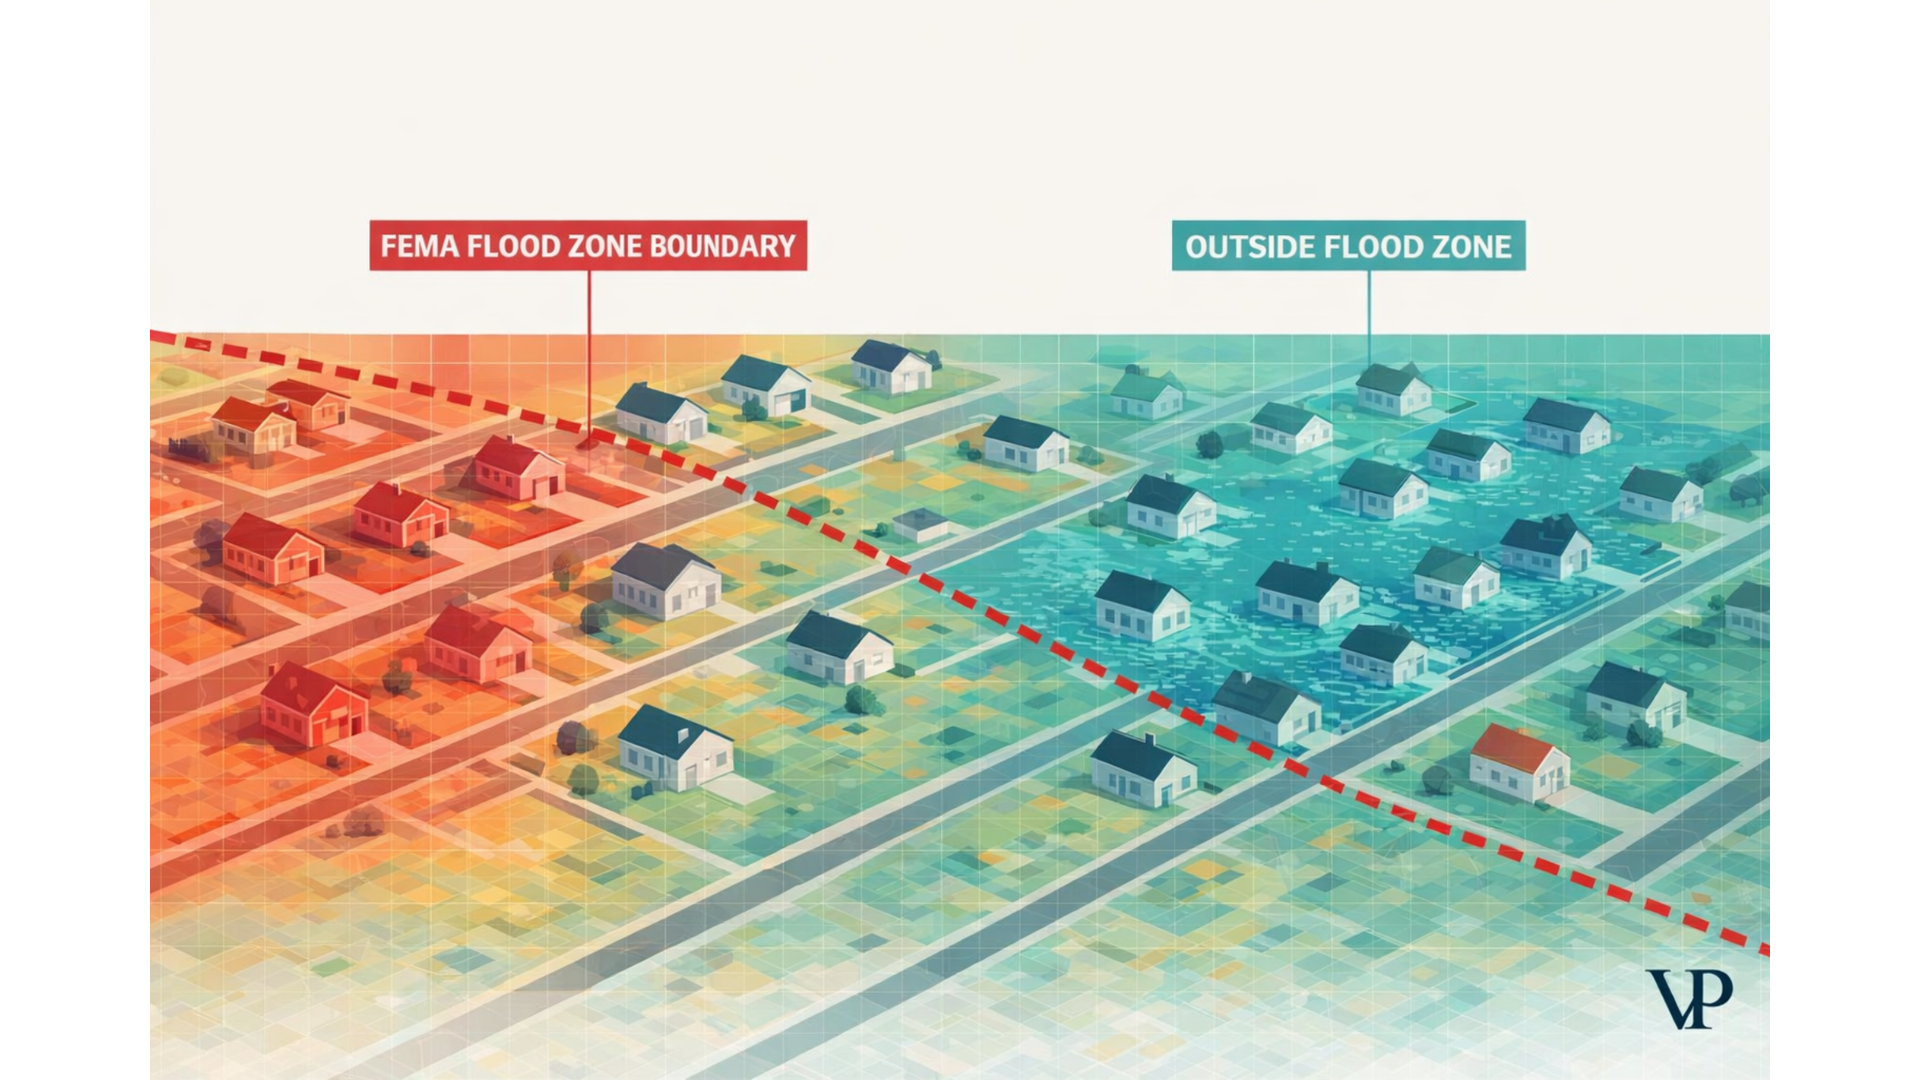
Nearly 68% of flood damage in the United States happens outside the zones that FEMA labels "high risk." That's not a rounding error. That's the majority of flood losses occurring in places where homeowners were told they were safe — often by a map that hasn't been updated since the Reagan administration.
I've spent the last year studying how insurers actually price flood risk, and what I found was unsettling. The system most carriers rely on treats flood risk like a light switch — you're either in a flood zone or you're not. Meanwhile, water doesn't care about zone boundaries. It follows gravity, topography, and the path of least resistance. And the gap between how we model flood risk and how flood risk actually behaves is costing the industry billions.
The fix isn't incremental. It's architectural. Pixel-level AI — the convergence of computer vision, satellite radar, and physics-informed machine learning — can assess flood risk at the level of an individual building, in real time, for pennies on the dollar compared to a single site visit. This is the shift from guessing to knowing.
The Map Problem Nobody Talks About
Roughly 75% of FEMA flood maps are more than five years old. About 11% date back to the 1970s and 1980s. These maps were drawn to solve a specific regulatory problem — defining which properties near rivers and coastlines needed mandatory insurance. They were never designed to capture the full picture of flood risk.
The most glaring blind spot? Pluvial flooding — the kind caused by heavy rainfall overwhelming drainage systems, not rivers overflowing their banks. If you've ever seen a parking lot turn into a lake during a downpour, that's pluvial flooding. FEMA maps largely ignore it.
This creates what engineers call a "cliff effect." A house one foot inside a flood zone pays thousands in mandatory insurance. Its neighbor one foot outside the boundary pays almost nothing. The actual difference in risk between those two properties? Often negligible. But one homeowner is overcharged, the other is dangerously underinsured, and fewer than 4% of American homeowners carry flood insurance at all — partly because the maps told them they didn't need it.
The majority of flood damage happens in places the maps say are safe.
When my team started pulling this apart, the economic consequences became obvious. Insurers using zip-code-level averages are essentially pooling high-risk and low-risk properties together and charging everyone the middle price. Sophisticated buyers — the ones who know their basement floods every spring — snap up the underpriced coverage. Low-risk homeowners, seeing a price that feels too high for their hilltop property, walk away. The risk pool deteriorates. Combined ratios climb. In 2023, the homeowners' insurance combined ratio hit 110.5%, meaning carriers paid out $1.10 for every dollar they collected.
This isn't a data problem. It's a granularity problem.
What a Building Actually Tells You About Flood Risk
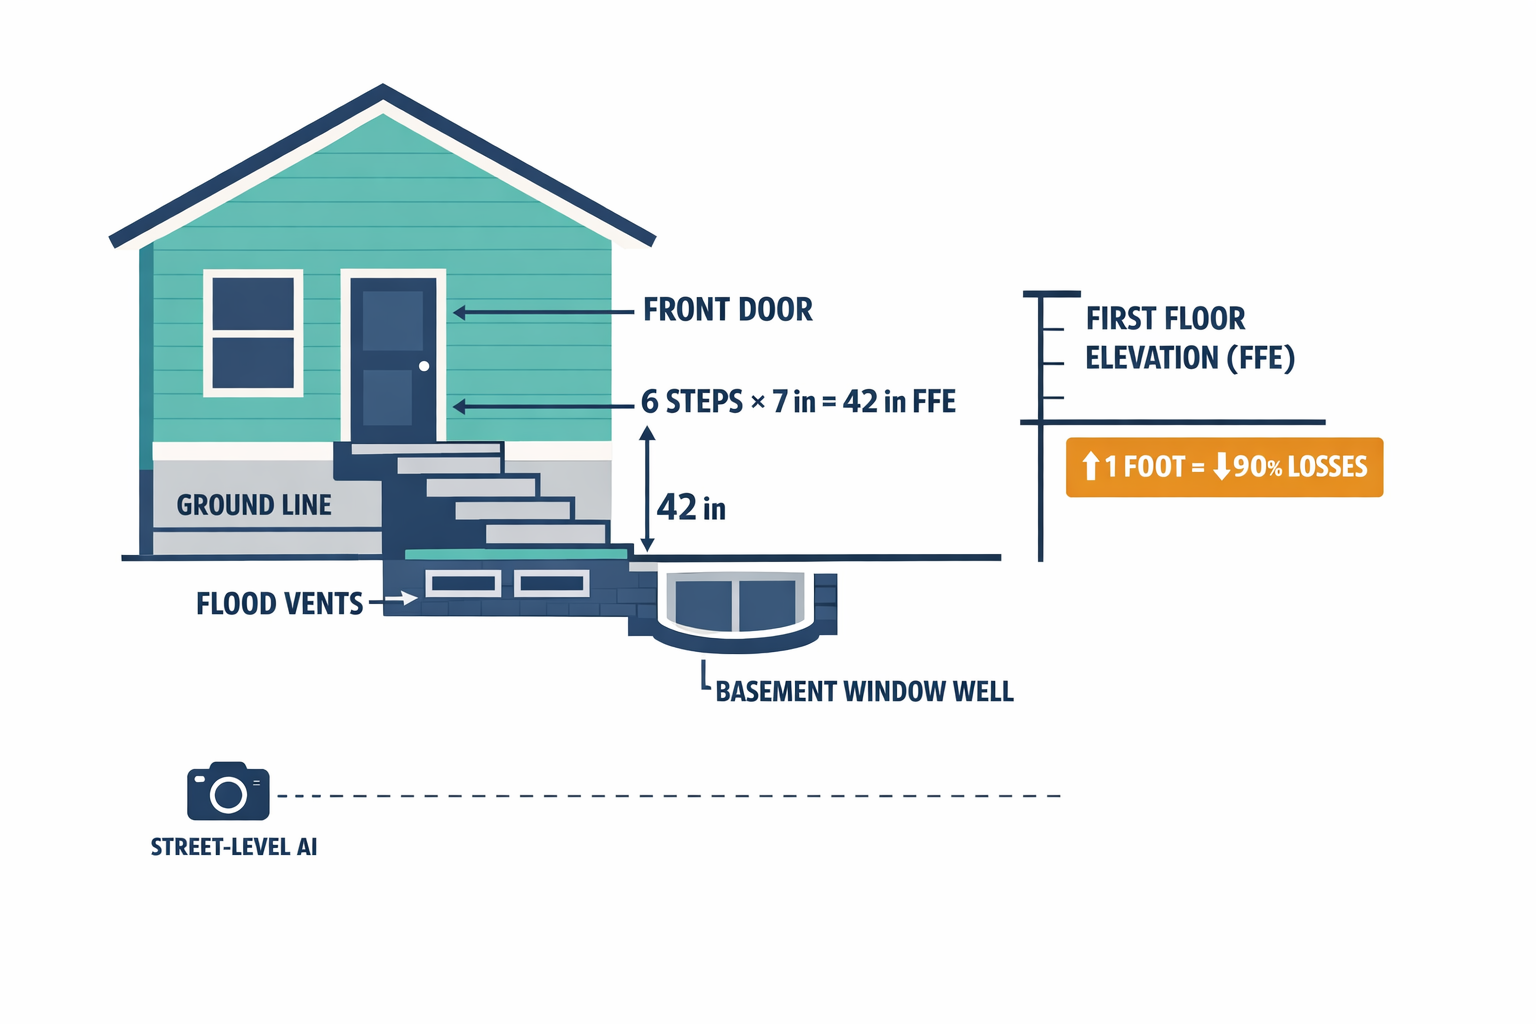
The single most important number in flood damage physics isn't how deep the water gets on the street. It's how high the building's lowest floor sits above that water. Insurers call this First Floor Elevation (FFE) — the vertical distance between the ground and the lowest habitable floor.
Raising a property's first floor by just one foot above the expected flood level can reduce average annual losses by approximately 90%. One foot. That's the difference between a total loss and a dry living room.
The problem is that almost nobody has this data. Public tax records don't capture it. Getting a professional Elevation Certificate costs hundreds of dollars per property and requires a surveyor on-site. So legacy models guess — they assume every home in a region has, say, a standard one-foot crawlspace. For millions of properties, that assumption is catastrophically wrong.
This is where computer vision changes the game. We explored this technology stack in depth in our interactive analysis of pixel-level flood underwriting, and the capabilities are remarkable.
Modern AI systems analyze street-level imagery — Google Street View, Mapillary, proprietary camera fleets — and extract FFE without anyone setting foot on the property. The AI identifies the ground line, the front door, the foundation, and the stairs. It counts steps. Building codes mandate a standard riser height of about 7 inches, so a home with six steps has a first floor roughly 42 inches above grade. Neural networks trained on this task have demonstrated average errors of just 0.218 meters — about 8.5 inches. Across millions of properties, simultaneously, without a single site visit.
Count the steps to the front door. That's the most important number in flood insurance — and AI can do it from a photograph.
From above, aerial and satellite imagery adds another layer. Computer vision algorithms calculate the ratio of concrete and asphalt to permeable ground on each parcel — a direct predictor of how much rainwater will run off versus soak in. They detect basement window wells, which confirm below-grade living space that dramatically increases potential losses. They even assess roof condition as a proxy for overall property maintenance, which correlates with claims severity across every peril.
The most exciting application, though, is mitigation-aware scoring. Legacy systems can't economically verify whether a homeowner installed flood vents, elevated their HVAC unit, or made other improvements. Computer vision spots these features automatically. Suddenly, insurers can reward the homeowner who invested in resilience with a lower premium — which encourages more investment in resilience. The incentives finally align.
Seeing Through Clouds: How Satellites Verify Floods in Real Time
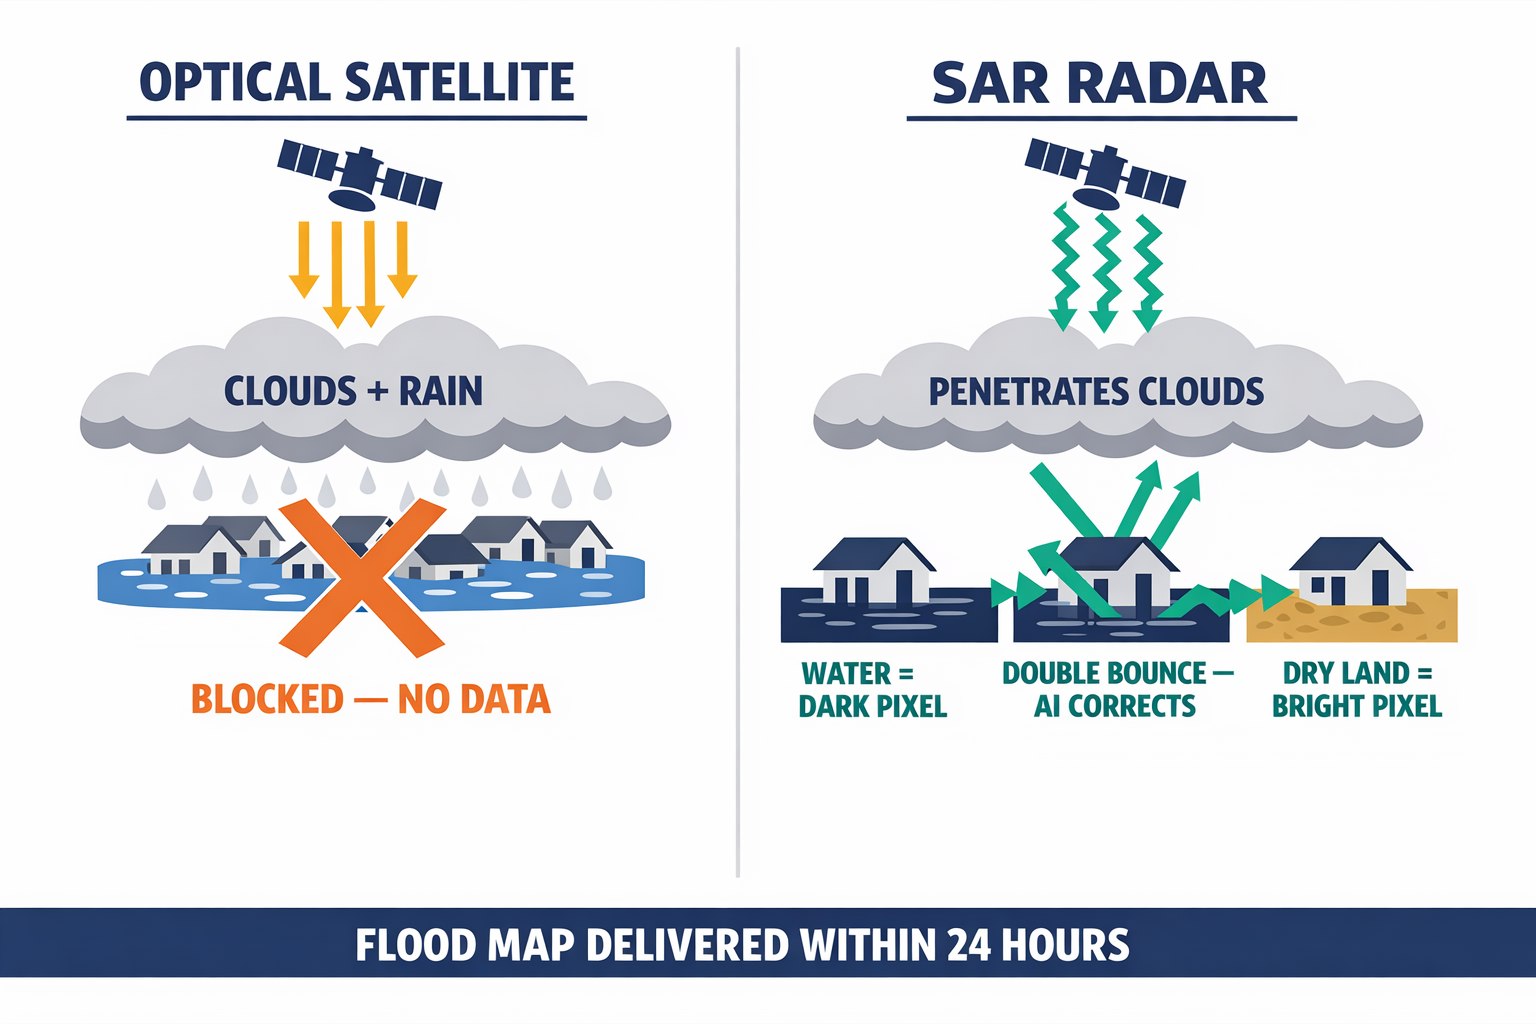
Computer vision tells you how vulnerable a building is. But when a storm actually hits, you need to know what's underwater right now. Traditional optical satellites — the ones that take photographs — have an obvious limitation: floods come with clouds and rain, which block the camera.
Synthetic Aperture Radar (SAR) solves this by using microwave pulses instead of light. These signals pass straight through clouds, smoke, and heavy rainfall. When the pulse hits calm water, it bounces away like light off a mirror — the satellite sees a dark pixel. When it hits dry land, the signal scatters back — the satellite sees a bright pixel. The contrast maps the flood boundary with remarkable precision.
Urban environments complicate things. Radar signals can bounce off floodwater, ricochet off a building wall, and return to the satellite with high intensity — a "double bounce" that looks like dry land when it's actually deep water. Deep learning models trained specifically on this pattern can now distinguish genuine urban flooding from these radar artifacts, something simpler algorithms consistently get wrong.
When SAR data is fused with optical imagery using machine learning, classification accuracy exceeds 92% even in complex landscapes. Commercial constellations like ICEYE deliver flood depth and extent data within 24 hours of an event's peak.
For insurers, this is transformative in three ways. They can instantly estimate total portfolio exposure by overlaying the satellite flood map on their book of business. They can dispatch adjusters only to properties confirmed as flooded, eliminating wasted trips. And they have an objective, timestamped record of exactly which properties were inundated — which means a claim alleging flood damage at a location the satellite shows was dry gets flagged immediately.
Simulating the Future, Not Just Observing the Past
Imagery and radar describe what has happened or what is happening. But underwriting is fundamentally about pricing what might happen. This requires simulation — running thousands of hypothetical storm scenarios against a specific property and calculating the expected damage.
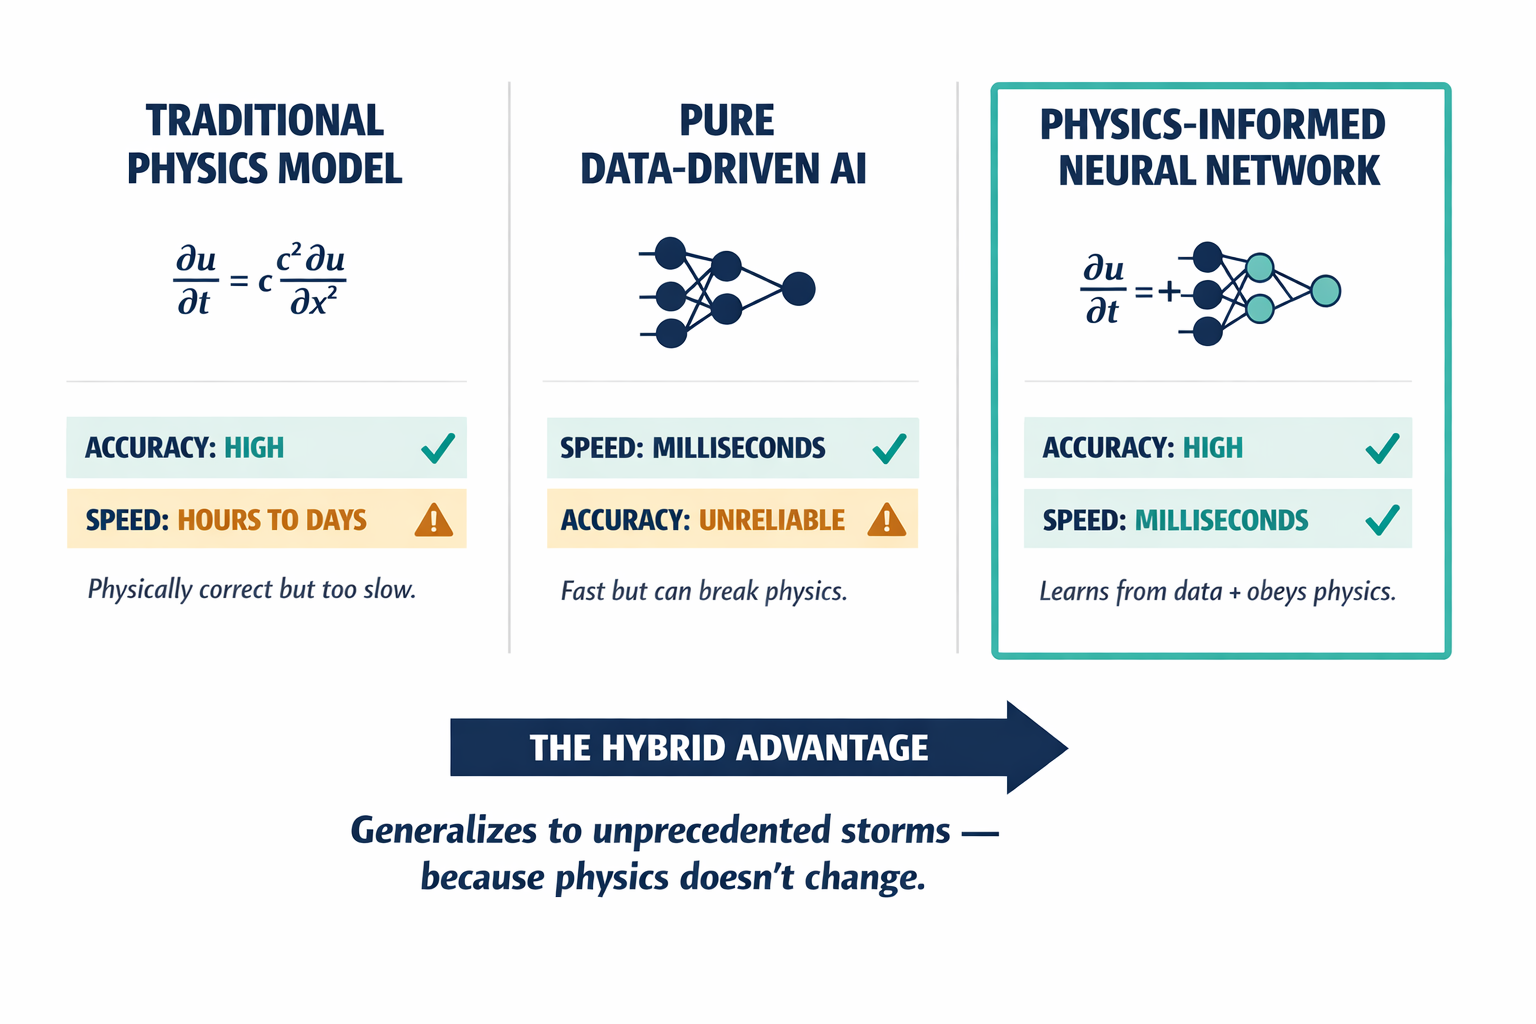
Traditional flood simulation software solves the equations governing how water flows across terrain. These models are physically accurate but painfully slow — hours or days for a single scenario on a single catchment. Purely data-driven AI, on the other hand, is fast but unreliable. It can predict scenarios that violate basic physics — water appearing out of nowhere, or flowing uphill.
Physics-Informed Neural Networks (PINNs) are the hybrid that makes this work. Think of it as an AI that went to physics school. The neural network learns from data like any AI, but it's also penalized whenever its predictions violate the laws of fluid dynamics — conservation of mass (water can't appear or disappear) and conservation of momentum (water respects gravity and friction).
A physics-informed neural network is an AI that's been taught the laws of water. It can hallucinate — but it can't break physics.
This constraint gives PINNs two critical advantages. They need far less training data because the rules of the game are already built in. And they generalize to unprecedented events — a storm bigger than anything in the historical record — because the underlying physics don't change even when the weather does.
Architectures like HydroGraphNet take this further by modeling entire watersheds as connected networks, predicting how rainfall in the upper basin propagates downstream hours later. For the full technical methodology behind these simulation approaches, see our detailed research on deep AI in flood risk underwriting.
The practical result: instead of assigning a property a static "Zone AE" rate, an underwriting engine can simulate that specific building's response to everything from an afternoon thunderstorm to a Category 5 hurricane — and generate a premium reflecting the true, integrated risk. In real time. At quote.
The Business Case Is Already Closed
This isn't speculative technology. The economics are already compelling.
When I walked through the numbers with my team, three things stood out. First, loss ratios drop because you stop accidentally underpricing properties that look safe on a 1985 map but flood regularly. Second, expense ratios drop because automated FFE extraction and satellite-based claims triage replace manual inspections and field adjusting. Third — and this is the competitive weapon — you can profitably insure properties your competitors won't touch.
A home sitting in a FEMA flood zone but elevated four feet above the base flood elevation is a great risk. Legacy insurers either reject it or overprice it because their models can't distinguish it from the house next door with a sunken basement. A pixel-level model sees the difference instantly.
The same granularity enables parametric insurance — products where payout triggers automatically if satellite data confirms flood depth exceeding a threshold at the property's coordinates. No claims adjuster. No weeks of waiting. Immediate liquidity for the policyholder.
And there's a regulatory advantage that surprised me. Because physics-informed models are grounded in explicit physical equations, their outputs are explainable. An insurer can demonstrate to a state regulator that a premium increase is driven by a measurable hydraulic risk — not an opaque algorithmic correlation. In an era of increasing AI scrutiny, this "glass box" quality matters enormously.
What About the Implementation Challenges?
The most common pushback I hear: "This sounds great in a whitepaper, but our systems run on Guidewire and SQL databases." Fair. Graph neural networks require graph-structured data, not tabular rows. Satellite feeds need cloud-native processing pipelines. The integration isn't trivial.
But the path is clear. Establish API connections with orbital data providers and aerial intelligence firms. Deploy cloud environments capable of handling geospatial datasets at scale. Then integrate model outputs directly into existing policy administration systems for real-time rating.
The harder question is organizational, not technical. Actuarial teams built on decades of historical-average methodology don't pivot overnight. The transition requires rethinking how risk is represented — from probabilistic aggregation across populations to physics-based assessment of individual structures. That's a cultural shift as much as a technical one.
What gives me confidence is that the alternative — continuing to price flood risk with tools from the 1980s while climate volatility accelerates — isn't really an alternative at all. It's a slow-motion solvency crisis.
The Risk Model That Never Stops Updating
The concept I keep returning to is the "living" risk model. Static annual renewals made sense when the data was static. But when a satellite can detect land subsidence in a neighborhood, when computer vision can observe a neighbor paving over their permeable lawn (increasing runoff onto your property), when a physics-informed simulation can re-run in milliseconds — why would you wait twelve months to update a risk score?
Continuous underwriting transforms the insurer from a payer of claims into something more like a risk partner. Mid-term adjustments. Proactive alerts. Premium credits when mitigation is verified. This is the model that closes the protection gap — not by making insurance cheaper across the board, but by making it accurately priced for every individual property.
The era of pricing flood risk from a paper map drawn before most of today's homeowners were born is ending. The question for every carrier is whether they lead this transition or get repriced by competitors who already have.
I'd be curious to hear from anyone in insurance, reinsurance, or climate risk — are you seeing this shift in your own portfolios? What's the biggest barrier you're facing?